Introduction
The broad discussion in many circles about the plight of the non-prime consumer often uses assumptions about how these consumers think, what matters to them, and even what would be good for them. However, there is limited data that really explains their circumstances.
Elevate’s Center for the New Middle Class seeks to understand the differences in attitudes, experiences and behavior between consumers with prime credit and those with non-prime credit.
This study represents results from a survey of 1,005 U.S. consumers (317 with non-prime and 609 with prime credit scores). Interviews were conducted in June 2018 to learn about behavior and attitudes around summer spending.
Non-prime Americans

“Non-prime Americans” represent the New Middle Class. These are Americans with a credit score below 700, meaning that their access to credit is limited or curtailed. Non-prime is also often further divided into “near prime,” “sub-prime,” and “deep sub-prime.”
It is the Center’s objective to better understand non-prime experiences, attitudes, and behavior.
The following report seeks to understand the financial implications of prime and non-prime consumers’ summer plans.
Executive summary
•Non-prime consumers are significantly less likely to have a vacation, big or small, planned for this summer compared to prime consumers.
•They are, however, more likely to have a “staycation” planned, likely to make up for the lack of travel.
•When they are taking vacations, they plan to spend about half as much per person in the household.
•Non-prime consumers are twice as likely to say they have had to turn down invitations for summer trips, outings, or events due to budget constraints.
•They are also 61% more likely to say they are borrowing money or carrying a balance on credit cards to pay for summer activities and expenses.
•Those not taking a vacation belong to a segment that seems to be missing out the most: they are less likely to utilize community resources for summer activities.
Going and Doing
Plans to take a vacation
Non-prime consumers are 29% less likely to take a vacation.
They are 52% less likely to take a “big vacation (20% vs. 41%) (not graphed)
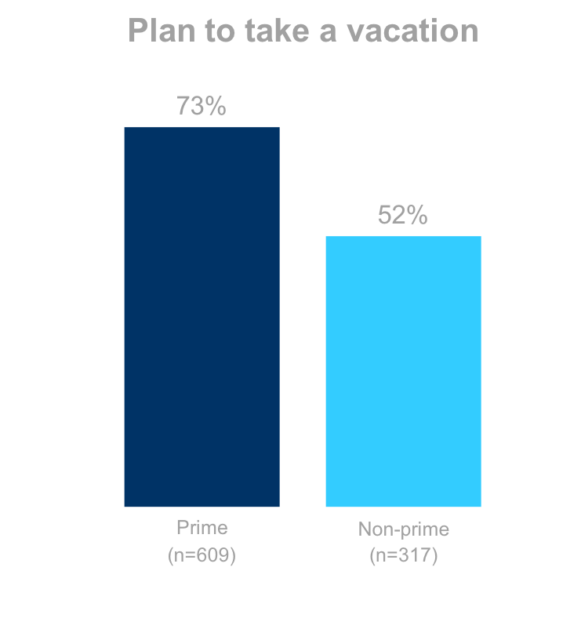
…and 24% less likely to take a “small vacation” (47% vs. 62%) (not graphed)Q5. How much do you agree or disagree with the following statements? I plan to take a big vacation away from home this summer & I plan to take a small vacation away from home this summer Prime n=609, Non-prime n=317
Q5. How much do you agree or disagree with the following statements? I plan to take a big vacation away from home this summer & I plan to take a small vacation away from home this summer Prime n=609, Non-prime n=317
Source: Summer Expense, July 2018
Plans to take a staycation
Non-prime consumers are 22% more likely to say they plan on taking time of, but staying at home—a staycation.
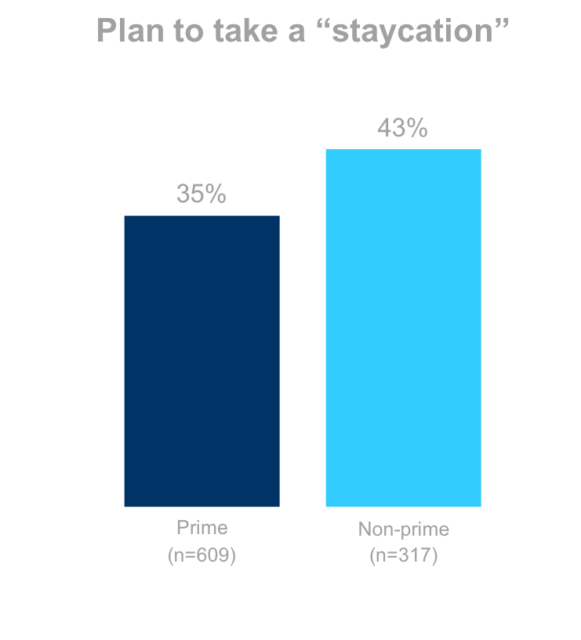
Q5. How much do you agree or disagree with the following statements? I plan to have a “staycation“- top 2 box
Prime n=609, Non-prime n=317
Plans to take a staycation
Non-prime consumers are twice as likely to say they have turned down invitations for summer trips, outings or events because they “didn’t have the money to spend this year.”
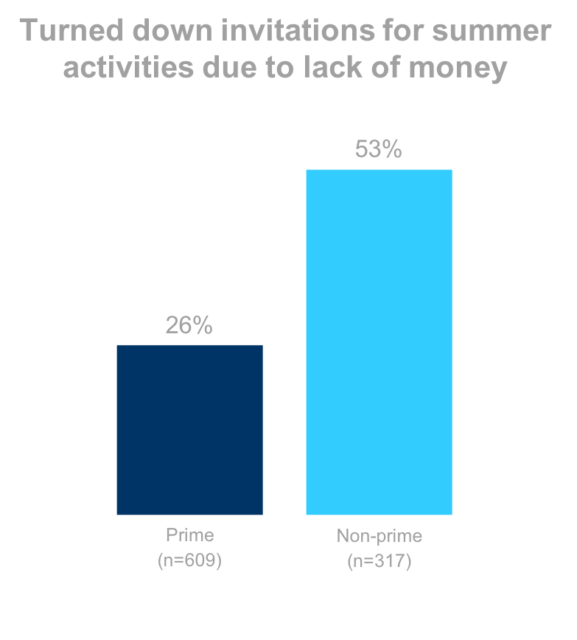
Q5. How much do you agree or disagree with the following statements? I have had to turn down invitations for summer trips, outings, or events because I didn’t have the money to spend this year- Top 2 box
Prime n=609, Non-prime n=317
Using community resources
When considering the use of community resources (e.g., parks, pools, community centers), prime and non-prime consumers engage at the same rate.
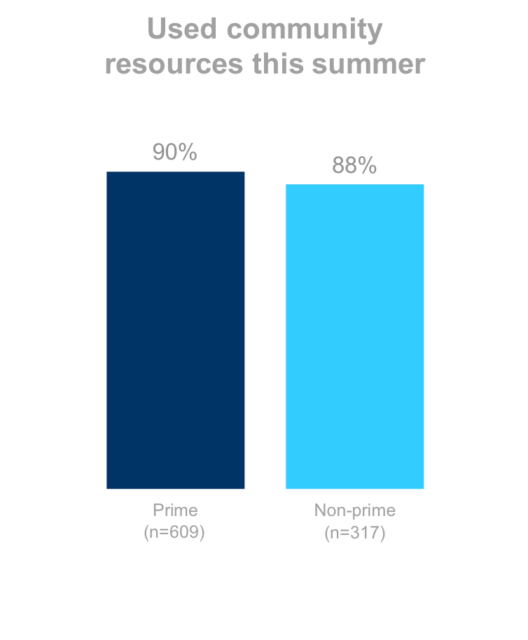
Q5. How often do you utilize the following resources in your community during the summer?
Prime n=609, Non-prime n=317
Types of community resources used
Prime consumers are slightly more likely to engage in programs that could carry a larger financial commitment like programs at a community center and camps and classes offered by schools.
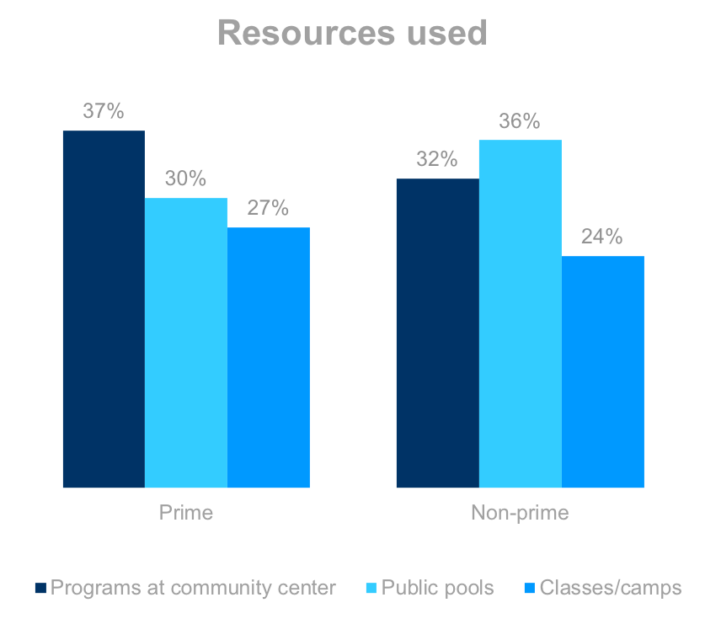
Non-prime consumers are more likely to enjoy public pools.
Q5. How often do you utilize the following resources in your community during the summer? “Special programs organized at your public library or community center”; “Public pools”; “Sports, classes, or camps organized by your city or schools”
Prime n=609, Non-prime n=317
General activity of the non-prime consumers
Those non-prime consumers who plan on taking a vacation still engage more with free community resources.
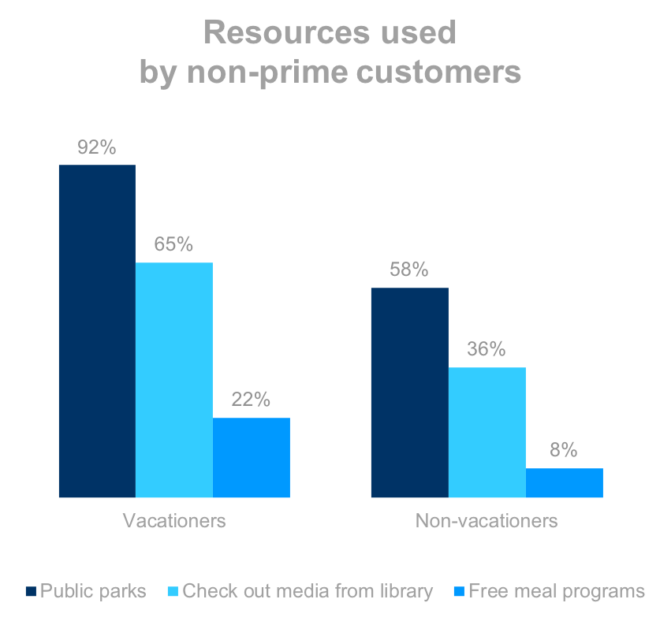
Q5. How often do you utilize the following resources in your community during the summer? Non-prime n=317
Source: Summer Expense, July 2018
Spending and borrowing
Vacation spending
Non-prime consumers plan to spend roughly half as much per person on vacations.
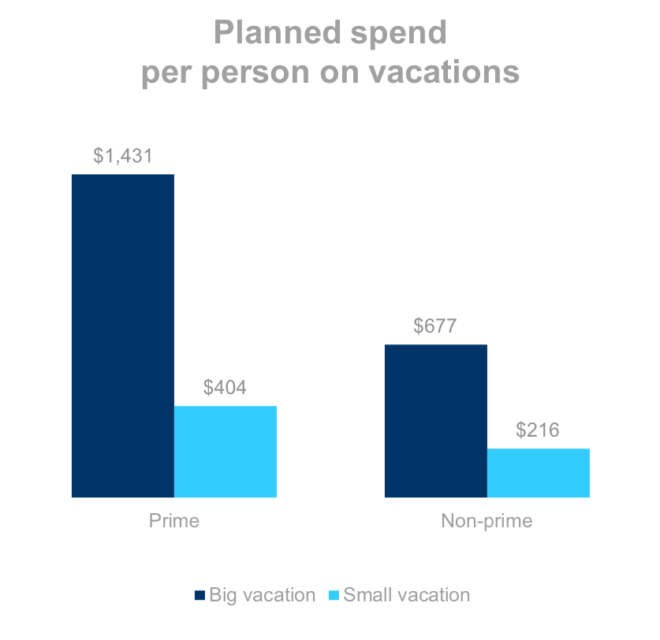
Q.2. How much do you think you’ll be spending on the following categories this summer? If you do not plan to spend on a particular category, please enter “$0.”
Prime n=609, Non-prime n=317
Borrowing to cover the costs
Non-prime consumers are 61% more likely to say they have had to borrow money or carry a balance on their credit cards to pay for summer activities or expenses.
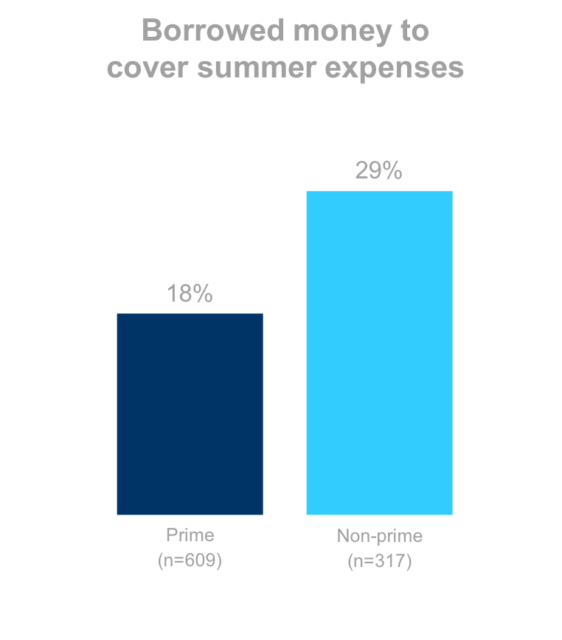
Q5. How much do you agree or disagree with the following statements? I have had to borrow money or carry a balance on my credit card to pay for summer activities or expenses this year- Top 2 box
Prime n=609, Non-prime n=317
Effect of children on summer spending
Children drive summer entertainment spending
Unsurprisingly, households with children are more than twice as likely to agree that they spend a lot of money to entertain themselves and their family this summer.
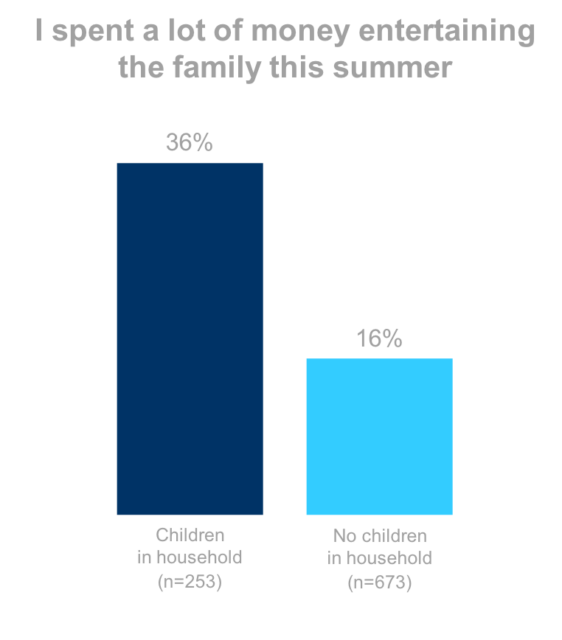
Q5. How much do you agree or disagree with the following statements? I find myself spending a lot of money trying to keep myself and my family entertained this summer- Top 2 box
Children in HH n=253, No Children in HH n=673
Children drive summer borrowing, too
Still, households with children are also much more likely to admit to borrowing money to fund summer activities.
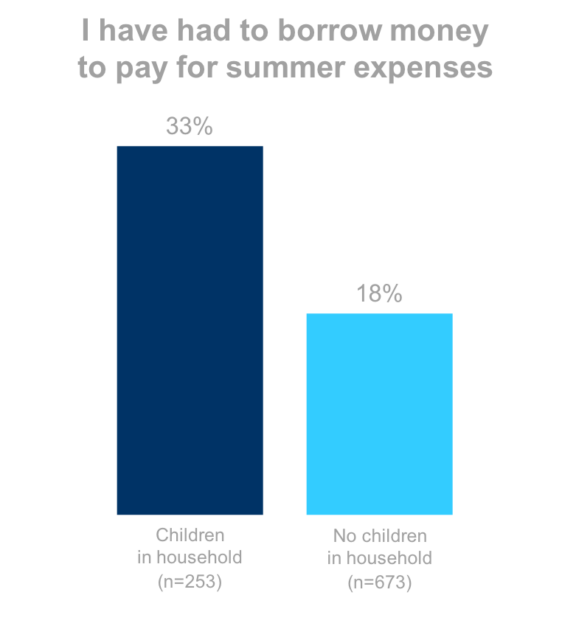
Q5. How much do you agree or disagree with the following statements? I find myself spending a lot of money trying to keep myself and my family entertained this summer- Top 2 box
Children in HH n=253, No Children in HH n=673
Total activity spending for households with children
Overall, households can expect to spend about $250 per child on summer activities.
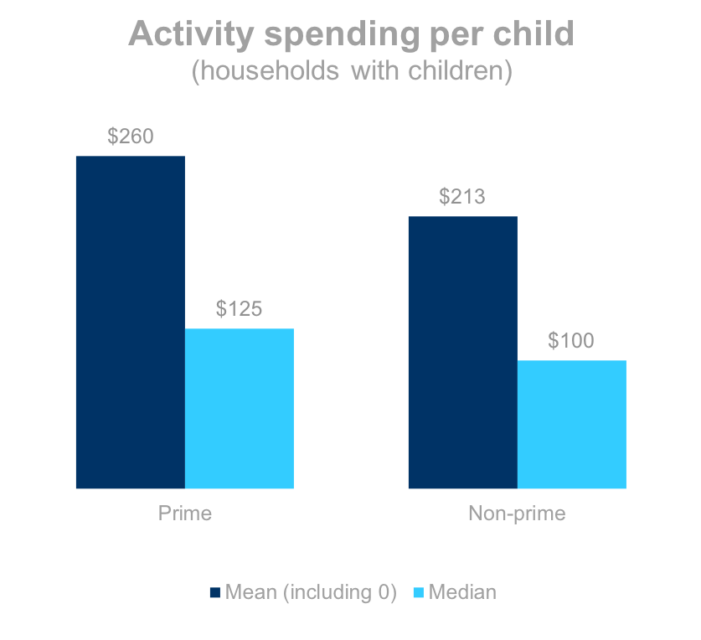
Non-prime households with children spent 20% less per child than prime households with children.
Q.2. How much do you think you’ll be spending on the following categories this summer? If you do not plan to spend on a particular category, please enter “$0.”
Prime w/ children n=149, Non-prime w/ children n=104
Childcare costs
Non-prime consumers are less likely to spend money on childcare during the summer.
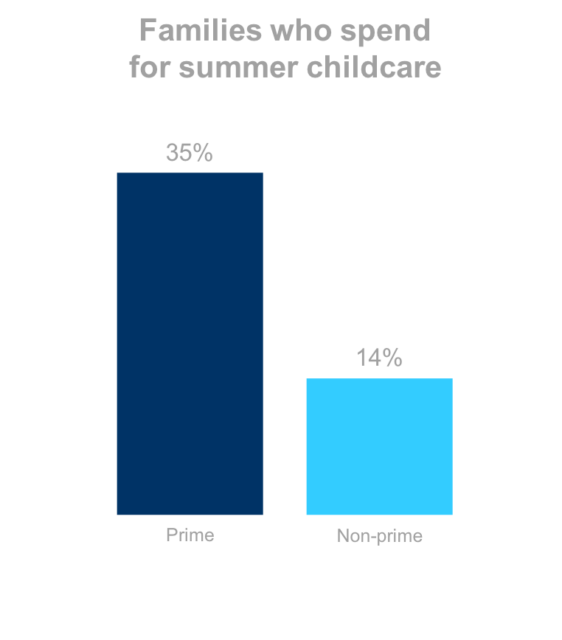
Q.2. How much do you think you’ll be spending on the following categories this summer? If you do not plan to spend on a particular category, please enter “$0.”
Prime w/ school-aged children n=121, Non-prime w/ school-aged children n=83
Methodology
The primary purpose of this study was to determine how nonprime Americans were similar or different from those with prime credit when it comes to spending on activities related to summer entertainment.
Interview Dates: June 18-20, 2018
Sample Specs:
•Total Respondents = 1,005 (317 non-prime, 609 prime)
•Sample Source: Ipsos eNation Omnibus
Qualification Criteria:
•Ages 18+
•Personal income: Any
•Geography – U.S. Rep
Survey Instrument: 5 custom questions on the Ipsos Omnibus survey.
About
About Elevate’s Center for the New Middle Class
Elevate’s Center for the New Middle Class conducts research, engages in dialogue, and builds cooperation to generate understanding of the behaviors, attitudes, and experiences of America’s growing “New Middle Class.”
For more information, visit: www.elevate.com/NewMiddleClass
Contact
NewMiddleClass@elevate.com
@NewMidClass
Facebook.com/NewMiddleClass