Introduction
The broad discussion in many circles about the plight of the non-prime consumer often uses assumptions about how these consumers think, what matters to them, and even what would be good for them. However, there is limited data that really explains their circumstances.
Elevate’s Center for the New Middle Class set out to understand the differences in attitudes, experiences and behavior between consumers with prime credit and those with non-prime credit.
This study represents results from the survey of 1,217 Americans, using interviews conducted December 6-14, 2016.
Executive Summary
Non-prime Millennials’ households are larger and busier than their prime counterparts
- They are 68% more likely to live in households with 4+ people
- 55% more likely to live in a household with children
- 17% less likely to claim the title of the sole decision maker; they share at least some decisions
Non-prime Millennials working life:
- Much less likely to have two income-producing adults in the household
- 21% of them hold more than one job
- 74% of them have employment that pays by the hour, compared to 54% for primes
- 34% less likely than prime to take a vacation
- 36% more likely than non-primes of other generations to report recent employment change
- 33% started a new job in prior 12 months
- 14% of them were laid off
Non-prime Millennials are optimistic:
- Non-prime Millennials are more optimistic than Gen-X or Baby Boomers that they can attain their goals for financial security
- Both prime and non-prime Millennials believe in their ability to meet the needs of a future jobs market
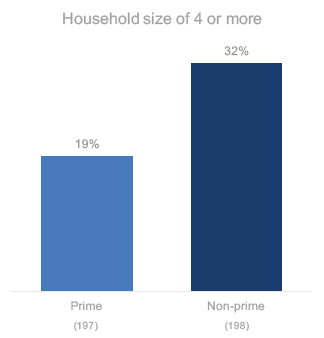
Full House
One third of non-prime Millennials live in a household of at least four people.
That is 68% more likely than their prime counterparts.
Q27. On a scale of 1 to 5, where 1 is ‘strongly disagree’ and 5 is ‘strongly agree’, how much do you agree or disagree with the following statements?
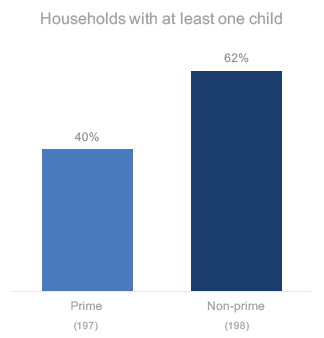
Kids Present
Non-prime Millennials are 55% more likely to live in a household with a child present.
Less than half of prime Millennials live with a child.
Q27. On a scale of 1 to 5, where 1 is ‘strongly disagree’ and 5 is ‘strongly agree’, how much do you agree or disagree with the following statements?
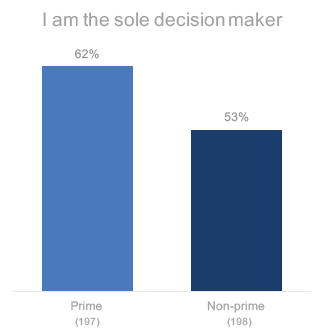
Managing Millennials’ Household Finances
Prime Millennials are 17% more likely than non-prime to be sole decision-makers in their household.
Q1. How would you describe your role when it comes to managing your household’s finances?
Non-prime Millennials are more likely to share some, but still retain most of the decisions.
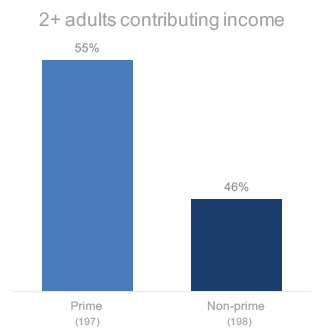
Working Adults Per Household
Prime Millennials are 20% more likely to live in households with more than one adult contributing income.
Fewer than half of non-prime Millennials have income help from others in the household.
Q9. Including yourself, how many adults in your household earn an income from outside employment, a business you/they own, or retirement/trust/investment disbursements?
Working Hard
1 in 5 non-prime Millennials hold two or more jobs that contribute to the household income.
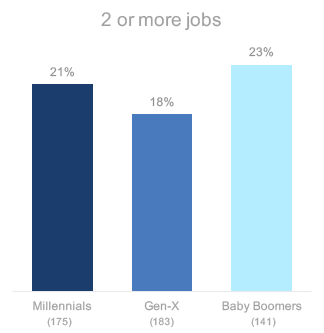
Q7. How many jobs do you currently hold that contribute to your household income?
Working by the Hour
Three quarters of non-prime Millennials work jobs that pay by the hour.
They are 25% more likely to be hourly employees than non-Millennial non-primes (61% of whom work by the hour).
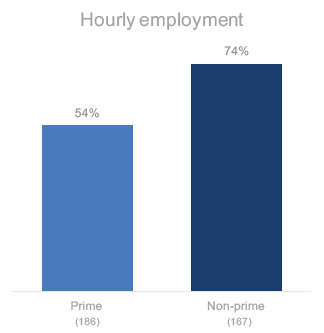
Q8. Please indicate below how you are paid by your employer(s)?
Staying Home
Non-prime Millennials are 34% less likely to have taken a vacation when compared to their prime counterparts.
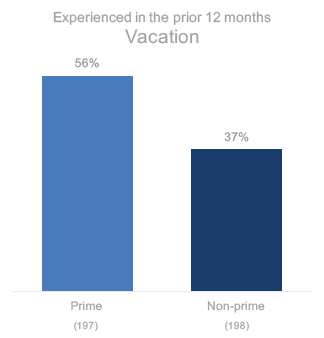
Q13. In the previous 12 months, please indicate if you or anyone else in your household experienced any of the following events?
Employment Instability
Non-prime Millennials are 36% more likely than other generations to experience some significant employment changes in the prior 12 months.
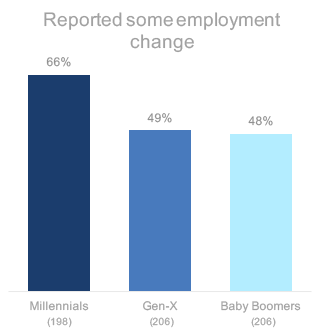
Q10. Which of the following employment events occurred to you or someone in your household in the previous 12 months? (Statistic represents respondents who selected something other than “None of the above”)
Beginning a New Job
Non-prime Millennials are 65% more likely than other generations to report starting a new job prior 12 months.
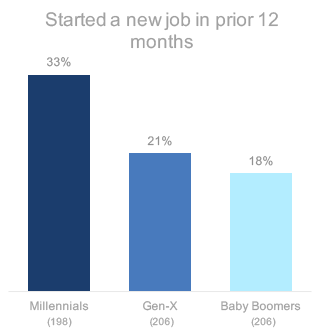
n = 198; Q10. Which of the following employment events occurred to you or someone in your household in the previous 12 months?
Nearly 1 in 6 non-prime Millennials was laid off in the prior 12 months: 75% more often than their prime counterparts.
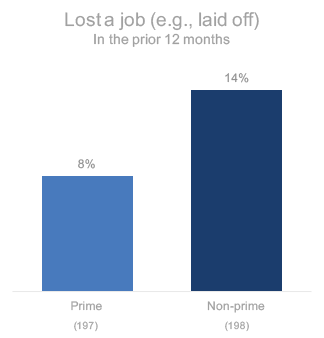
n = 198; Q10. Which of the following employment events occurred to you or someone in your household in the previous 12 months?
Confidence in the Future
Non-prime Millennials are more optimistic than Gen-X or Baby Boomers that they can attain their goals for financial security.
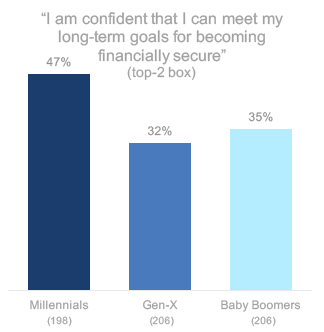
Q27. On a scale of 1 to 5, where 1 is ‘strongly disagree’ and 5 is ‘strongly agree’, how much do you agree or disagree with the following statements?
Confidence in Job Skills for the Future
Both prime and non-prime Millennials believe in their ability to meet the needs of a future jobs market.
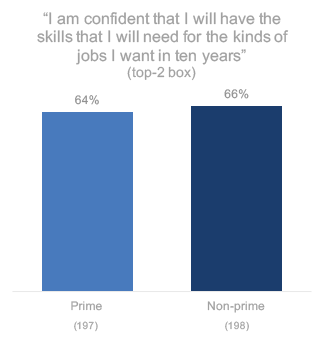
Q27. On a scale of 1 to 5, where 1 is ‘strongly disagree’ and 5 is ‘strongly agree’, how much do you agree or disagree with the following statements?
Nonprime Americans
“Subprime” is often used to represent people with scores below 640. People with 641 to 700 are sometimes called “near prime.” We have elected to use the clearer designation of “nonprime” for all consumers with scores below 700.
“Nonprime Americans” represent the New Middle Class. These are Americans with a credit score below 700, meaning that their access to credit is limited or curtailed. It is the Center’s objective to better understand their experiences, attitudes, and behavior.
Methodology
The primary purpose of this study was to determine how non-prime Americans were similar or different from those with prime credit on a range of behaviors and attitudes.
Interview Dates: December 6-14, 2016
Sample Specs:
- Total Respondents = 1,217
- Sample Source: Research Now Consumer Panel
Qualification Criteria:
- Ages 18-64
- Personal income: Any
- Geography – U.S. Rep
- Has primary or shared responsibility managing HH finances
- Employment: No students or unemployed
- Has a checking or savings account
Survey Instrument: 15 minute online questionnaireMore in Reports