
For many Americans, the pandemic followed by inflation have been a one-two punch. Just as the country re-opened and it looked as though people could get back to normal, inflation hit consumers at the gas pump and grocery store. Now, the threat of a recession looms. The question that remains is how Americans will handle this uncertainty.
The Survey of American Household Finances (SAHF) has tracked over 50 different financial metrics monthly since 2018. The longitudinal nature of the data clarifies trend from noise. Through the first half of 2022, SAHF analysis shows points of stress in addition to opportunities for optimism. More households are feeling the strain of inflation, and more are struggling with day-to-day costs, but the number of households with more than $2,000 of consumer debt is at a four-year low. Many are also feeling less secure than they were last year, but they are not reporting financial stress. And while expenses have put increased pressure on household finances, incomes have stabilized, and employment continues to rise.
Highlights:
The Survey of American Household Finances (SAHF/Q2) reports recent trends in American households:
- Financial insecurity is now the highest it’s been for prime consumers since The Survey of American Household Finances started collecting data in 2018: 19% of prime consumers (those with credit scores of 700 and above) and 37% of non-prime consumers (those with credit scores below 700) feel less secure than they did a year ago.
- 22% of prime households report that day-to-day expenses are harder to manage than a year ago. This is a huge increase after multiple quarters of decline in this metric.
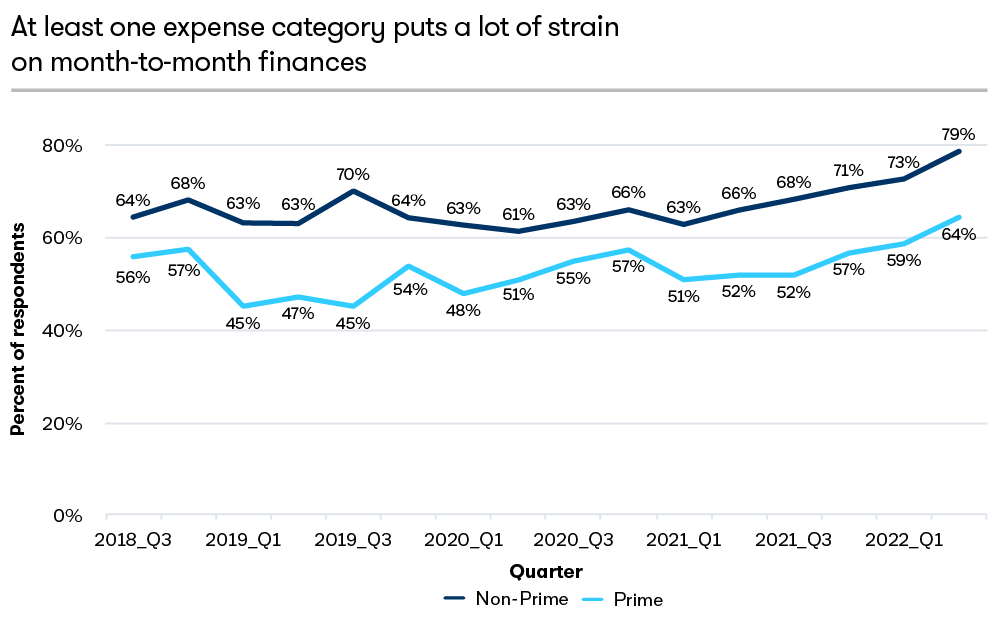
- Inflation is causing a lot of strain on 79% of non-prime consumers and 64% of prime consumers.
- Throughout Q2, high gas prices were straining Americans’ pocketbooks: 52% of non-prime Americans reported that gas prices were putting a lot of strain on their finances in Q2 of 2022; up from 25% who said the same pre-pandemic.
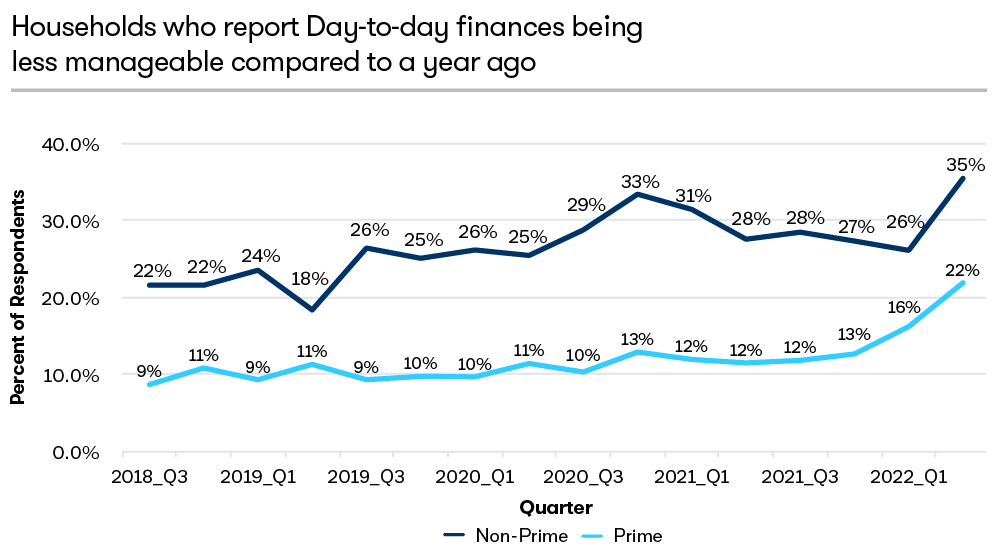
- Inflation has impacted the manageability of normal household expenses more dramatically than the shutdown of the economy during 2020 with 35% of non-prime respondents reporting that day to day finances are less manageable than the year prior.
Strain of Inflation:
- Inflation continues to strain household finances, with the latest increase of 9.1% being the highest in a generation.
- 79% of non-prime and 64% of prime households reported that at least one category is causing a lot of strain when asked whether monthly expenses are causing financial strain. This metric is reaching all-time highs.
- In Q2, 52% of non-prime and 37% of prime consumers reported that gasoline was putting a lot of strain on their finances. This is roughly double what these numbers were pre-pandemic.
Manageability of Day-to-day Expenses
- The fourth quarter of 2021 peaked in households that expressed that their day-to-day expenses were less manageable, with non-prime at 33% and prime at 13%.
- The current inflation has spiked those numbers in 2022, with those numbers now at 35% and 22% respectively.
- The data shows that the effect of recent inflation has impacted the manageability of normal household expenses more dramatically than the economic shutdown of 2020.
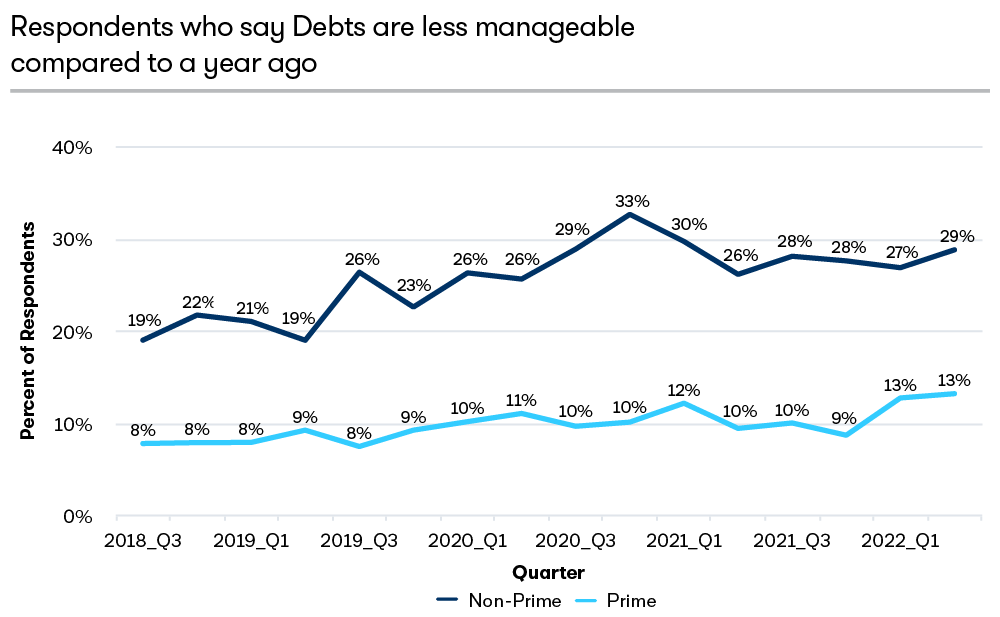
Manageability of Debts
- While debts are typically not affected as readily by short term impacts such as inflation, debt can be a serious headwind for peoples’ financial progress when other factors tighten finances.
- The pandemic caused an increase in the number of non-prime households reporting that their debts were less manageable compared to the prior year.
- While within the statistical margin of error, 29% of non-prime respondents say debts are less manageable compared to a year ago. This is the highest it has been since the first quarter of 2021.
- Prime respondents are having a different experience. They are experiencing a high at 13%, the highest number since we began the survey in 2018.
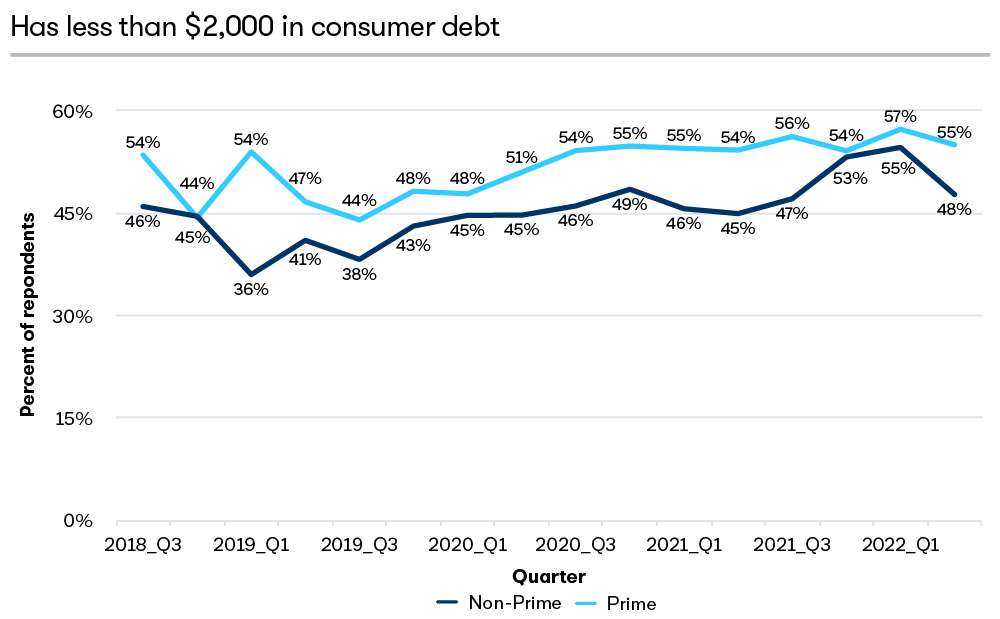
Household Debt
- Since the pandemic, there has been an increasing number of prime and non-prime households who report that they have less than $2,000 in consumer debt (excluding mortgage, auto, and student loans).
- Despite increasing inflation, the trend of lower debt continues. Both prime and non-prime metrics dipped in the second quarter of 2021, and now the number of households with less than $2,000 in consumer debt is higher than it was prior to the pandemic.
- The accumulation of household debt can be an indication of hope or immediate financial hardship. The growing number of households who are limiting their personal debt to under $2,000 may be an indication that Americans are being cautious about the current economic situation.
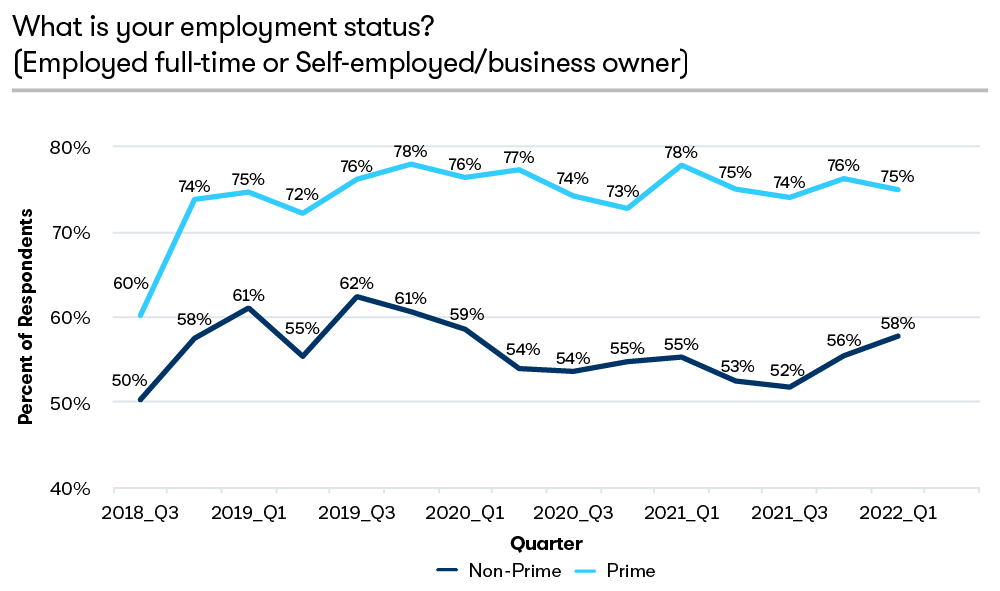
Employment
- Full-time employment held steady for prime workers throughout the pandemic, and while the metric hit a low point in the first quarter of 2022, it has since rebounded.
- The number of full-time and self-employed non-prime Americans dropped five percentage points at the start of the pandemic. This number has been climbing since the third quarter of 2021 and is reaching near pre-pandemic highs. This development has been a strength for non-prime workers post-pandemic.
- Recessions can cause the labor force to become more efficient. There is reason to believe that this efficiency was already gained during the economic downturn of the pandemic.3 This would lead us to believe that employment may be more stable for workers than macroeconomic data may suggest.
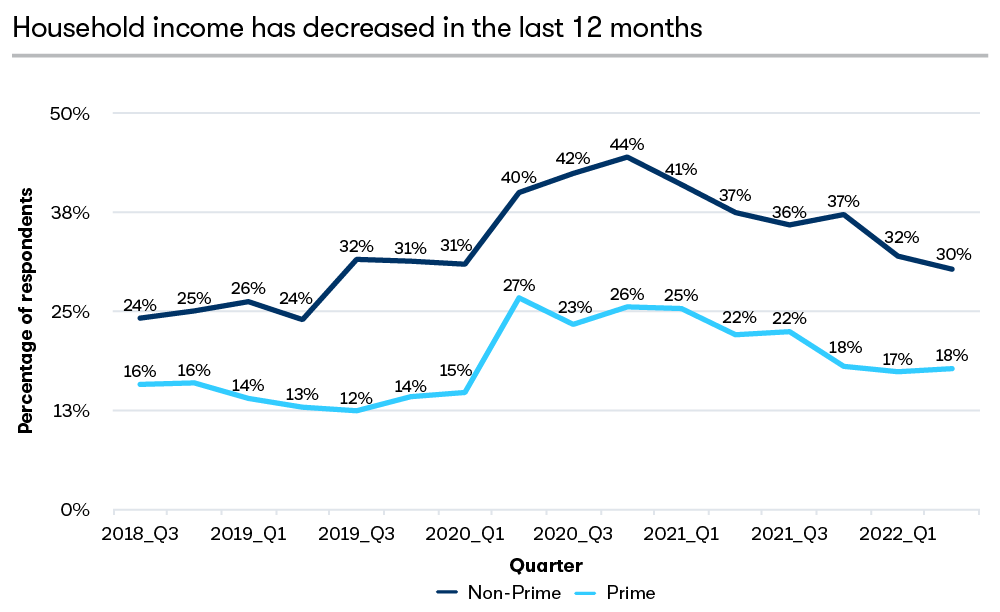
Change in Income
- Although many workers did not lose their jobs during the pandemic, a significant number reported a drop in their income. Many reasons could account for this, including pay cuts, decreased hours or elimination of bonuses.
- At their highs, 44% of non-prime and 27% of prime workers reported that their income had decreased from the prior year. The most recent data suggest that incomes are stabilizing and exhibiting much less volatility than in prior quarters.
- Inflation and a tight labor market has pressured employers to raise wages, it is unlikely that the American workforce will experience further income pressure in the short term.
; no, it has not changed; yes, it has decreased. Elevate’s Center for the New Middle Class, Survey of American Household Finances. October 2018 through June 2022. N = 22.071[1]
Running Out of Money
- A recent study by PYMNTS and LendingClub revealed that 61% of Americans were living paycheck-to-paycheck.4 The study demonstrated that the problem was neither limited to lower income classes nor by credit score band.
- The most recent SAHF data shows that 33% of prime and 42% of non-prime households experienced a disruptive, unexpected expense in the prior three months.
- Despite households struggling with raising inflation, the number of households who report that they never run out of money has remained constant through the last four quarters (prime 45%, non-prime 19%).
- This does not mean that households are absorbing the pressure comfortably. The number of non-prime households who say they run out of money at least four times a year has increased four percentage points.
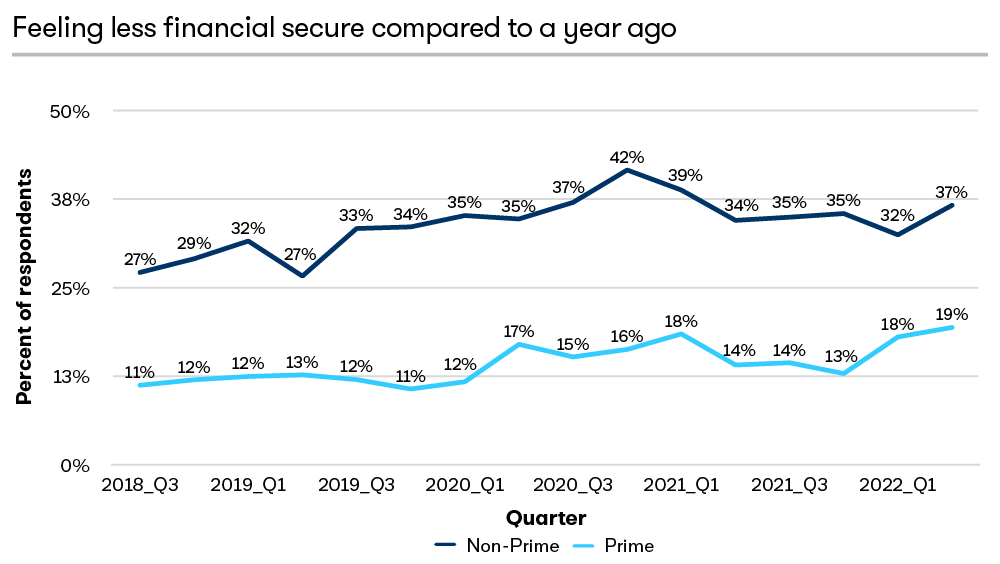
Feeling Less Financially Secure
- Continuous financial uncertainty resulting from the pandemic has diminished the psychological well-being of American Households.
- Sentiment of financial insecurity, after spiking during the pandemic, was declining steadily until prime consumer began to report uneasiness the first quarter of 2022 when inflation was increasing.
- A record 19% of prime Americans feel less financially secure than they did a year ago. Non-prime consumers spiked in the second quarter at 37%, marking the highest point since the first quarter of 2021.
Financial Stress
- Stress can be a measure of how well respondents feel they are handling their current circumstances and whether they sense continued difficulty in the near future.
- During the fourth quarter of 2020, prime respondents reported feeling that their finances caused them significant stress at a record high of 55%. This number returned to pre-pandemic levels and has been stable since.
- Non-prime respondents spiked in 2020 during the height of the pandemic, but it did not exceed pre-pandemic levels. This number continues to be stable.
- As inflation continues to rise, it can erode financial resilience and lead to feelings of stress for prime and non-prime. It is too early to tell whether the most recent slight uptick is the beginning of a trend or normal fluctuations of a stable metric.
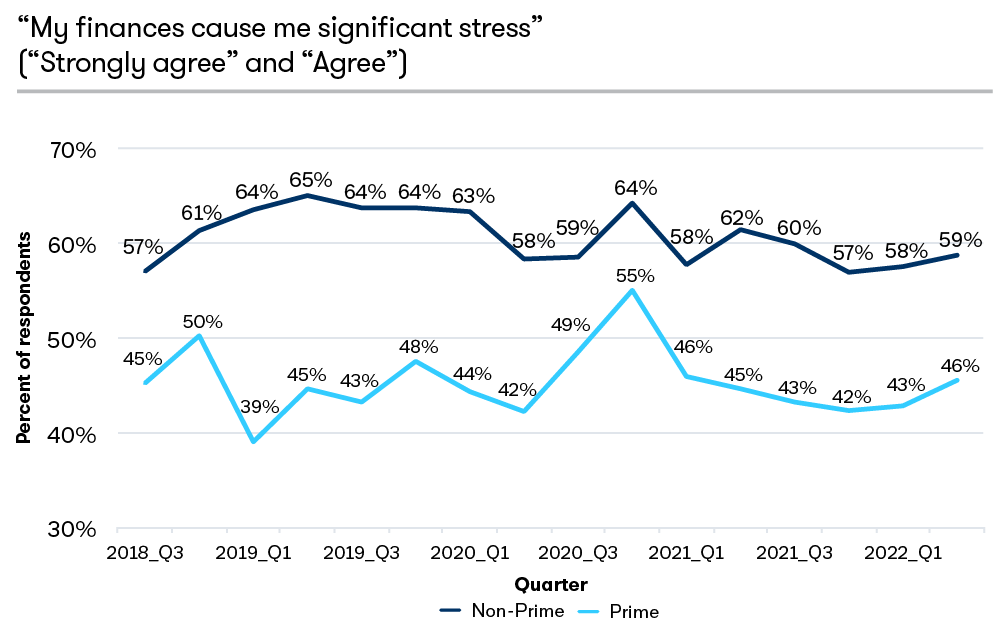
“How much do you agree or disagree with the following statements?” Statement: “My finances cause me significant stress.” Options: Strongly agree, agree, neither agree nor disagree, disagree, and strongly disagree. Elevate’s Center for the New Middle Class, Survey of American Household Finances. October 2018 through June 2022. N = 22.07
1[1]
Conclusion
As we likely enter a new phase in the economy, it is very uncertain how well everyday Americans will weather all this uncertainty. There are several measures that suggest a weakening in American households’ finances, and yet other measures suggest more resilience then otherwise assumed. Americans are feeling the daily impact of inflation on their finances on necessity such as gas, and groceries. Simultaneously, they are reporting less stress and are holding less consumer debt. Whether Americans become more adept at absorbing the continued pressure of inflation or household finances may crack under the pressure remains to be seen. The Survey of American Household Finances offers both reason for optimism and apprehension for consumers as the economy continuously evolves in a post-pandemic world.
Footnotes:
1 FRED, federal reserve economic data. St. Louis, MO: Federal Reserve Bank of St. Louis, 2022. Software, E-Resource. https://fred.stlouisfed.org/series/MEDCPIM158SFRBCLE.
2 Walker, Jonathan. “Americans Feeling the Sting of Inflation in Gas, Healthcare Costs,” Elevate’s Center for the New Middle Class. March 2022. https://www.newmiddleclass.org/americans-feeling-the-sting-of-inflation-in-gas-healthcare-costs/
3 FRED, federal reserve economic data. St. Louis, MO: Federal Reserve Bank of St. Louis, 2022. Software, E-Resource. Compare GDP numbers: https://fred.stlouisfed.org/series/GDP with All employee numbers: https://fred.stlouisfed.org/series/PAYEMS.
4 PYMNTS. “Report: 36% of Consumers Earning $250K+ Now Live Paycheck-to-Paycheck,” June 1, 2022. https://www.pymnts.com/consumer-finance/2022/report-36-of-consumers-earning-250k-now-live-paycheck-to-paycheck/
5 The CNMC has extensively studied this issue over the years. See “Non-prime Americans: The Scourge of Unexpected Expenses” published in 2017 and “More than half of non-prime Americans unable to cover two months of expenses without income” published in 2020.
Methodology or study details:
The tracker index is a longitudinal study measuring all aspects of American household finances. It collects responses from prime and non-prime consumers every month and has been running since September 2018. This analysis included 20,370 completed surveys of a questionnaire which measures over 50 variables related to personal and household finances.
- As of 6/30/2022, the total sample size of our survey is 22,276
- Initial survey collection was 150 prime and non-prime per month
- At the onset of COVID, we increased this to 100 prime and 100 non-prime per week
- We reduced this in late 2020 to 100 prime and 100 non-prime every 2 weeks
- In 2021, we settled on 100 prime and 100 non-prime twice monthly
- In May of 2022 we surveyed an extra 300 prime and 300 non-prime
| Total | 2018 Q3 | 2018 Q4 | ||
| Non Prime | 10,988 | 435 | 523 | |
| Prime | 11,088 | 620 | 482 | |
| Total | 22,076 | 1,055 | 1,005 | |
| 2019 Q1 | 2019 Q2 | 2019 Q3 | 2019 Q4 | |
| Non Prime | 450 | 451 | 450 | 450 |
| Prime | 451 | 450 | 450 | 450 |
| Total | 901 | 901 | 900 | 900 |
| 2020 Q1 | 2020 Q2 | 2020 Q3 | 2020 Q4 | |
| Non Prime | 546 | 1,315 | 1,337 | 969 |
| Prime | 450 | 556 | 1,337 | 1,375 |
| Total | 996 | 1,871 | 2,674 | 2,344 |
| 2021 Q1 | 2021 Q2 | 2021 Q3 | 2021 Q4 | |
| Non Prime | 712 | 870 | 607 | 618 |
| Prime | 990 | 710 | 903 | 633 |
| Total | 1,702 | 1,580 | 1,510 | 1,251 |
| 2022 Q1 | 2022 Q2 | |||
| Non Prime | 635 | 620 | ||
| Prime | 615 | 616 | ||
| Total | 1,250 | 1,236 |
CNMC:
Elevate’s Center for the New Middle Class (CNMC) is a non-profit research group sponsored by Elevate Credit (ELVT). The CNMC’s mission is to research the challenges, behaviors, and attitudes of American household finances, especially the impact of credit constraint on households’ financial resilience. Our studies can be accessed on our website NewMiddleClass.org or you can contact us directly with the email address NewMiddleClass@elevate.com.