Introduction
The broad discussion in many circles about the plight of the non-prime consumer often uses assumptions about how these consumers think, what matters to them, and even what would be good for them. However, there is limited data that really explains their circumstances.
Elevate’s Center for the New Middle Class set out to understand the differences in attitudes, experiences and behavior between consumers with prime credit and those with non-prime credit.
This study represents results from a survey of 1011 U.S. consumers (501 with non-prime and 510 with prime credit scores). Interviews were conducted January 12-17, 2017 to learn about actual behavior in the most recent holiday period.
For more details on the study, click here.

“Non-prime Americans” represent the New Middle Class. These are Americans with a credit score below 700, meaning that their access to credit is limited or curtailed. Non-prime is also often further divided into “near prime,” “sub-prime,” and “deep sub-prime.”
It is the Center’s objective to better understand their experiences, attitudes, and behavior.
The following report represents overall averages as well as a distinction between prime and non-prime experiences.
General Housing Measures
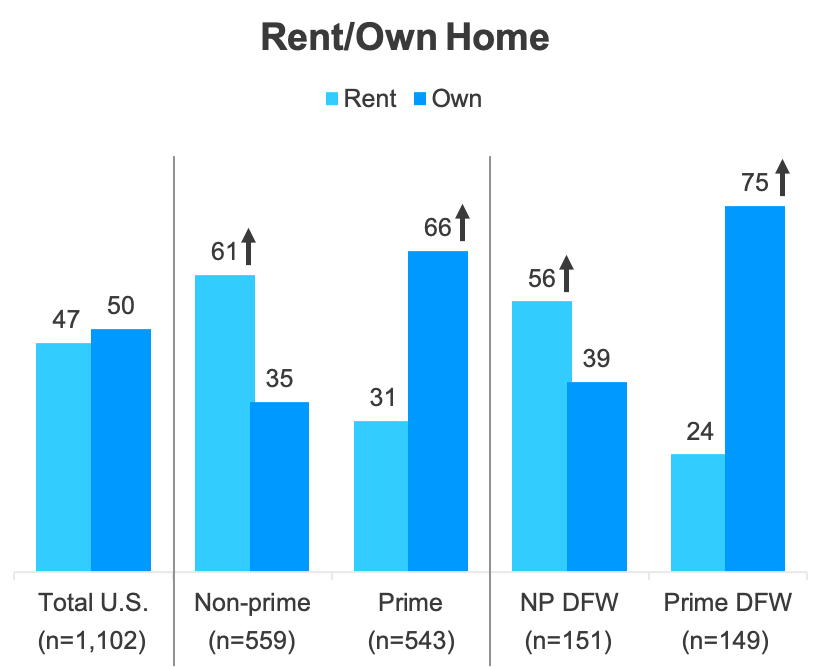
In the Total U.S., just over half the population own their home.
Almost two-thirds of Nonprime consumers rent their home, where only a third own it.
In the DFW metroplex, over half of nonprime rent, but almost three-quarter of prime consumer own their home.
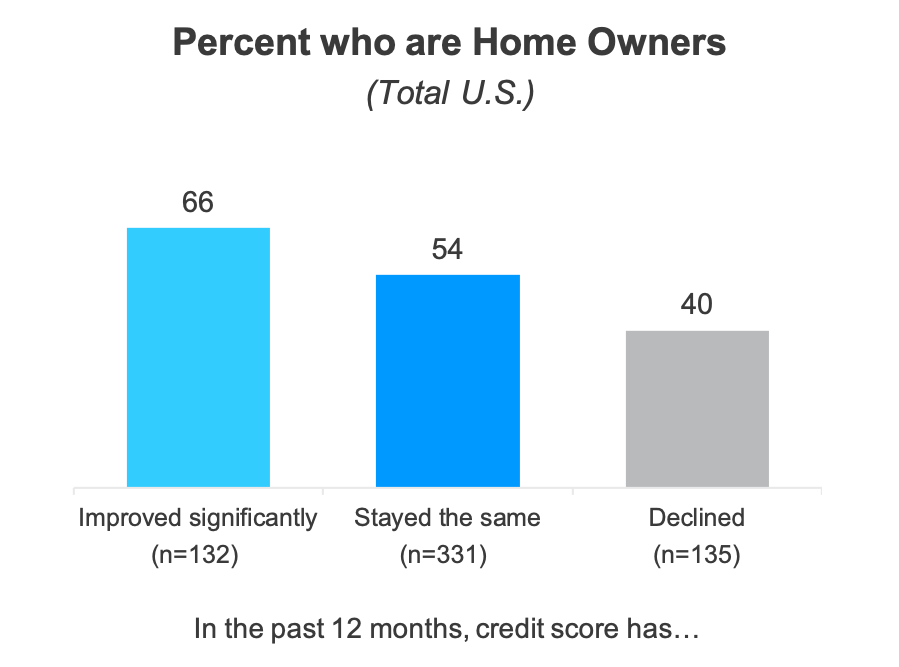
Consumers who are able to improve their credit score ‘significantly’ more likely to be home owners.
Consumers who are able to improve their credit score significantly are 22% more likely to own than those whose scores stay the same, and 65% more likely than those who declined.
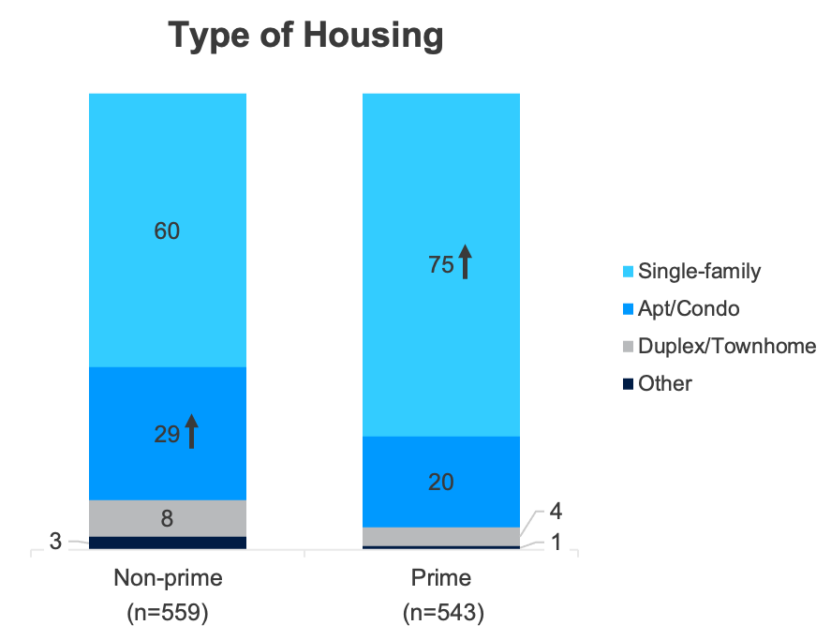
Most U.S. consumers live in a single-family home.
Although two-thirds of nonprime consumers live in a single-family home (which is less than the percentage of prime who do), the remaining third live in some form of a multi-family dwelling.
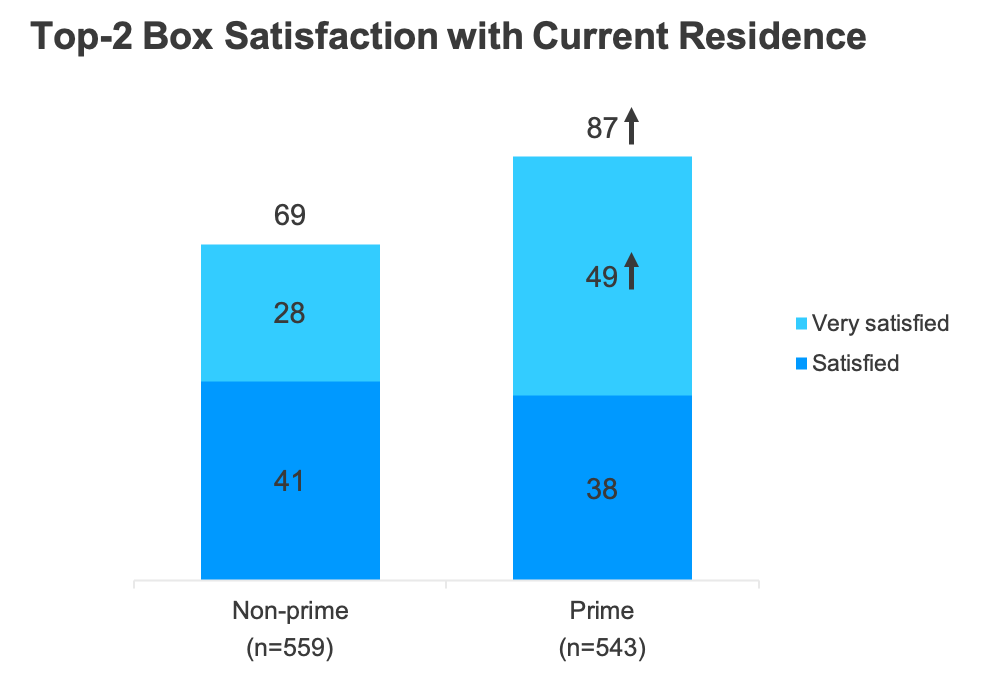
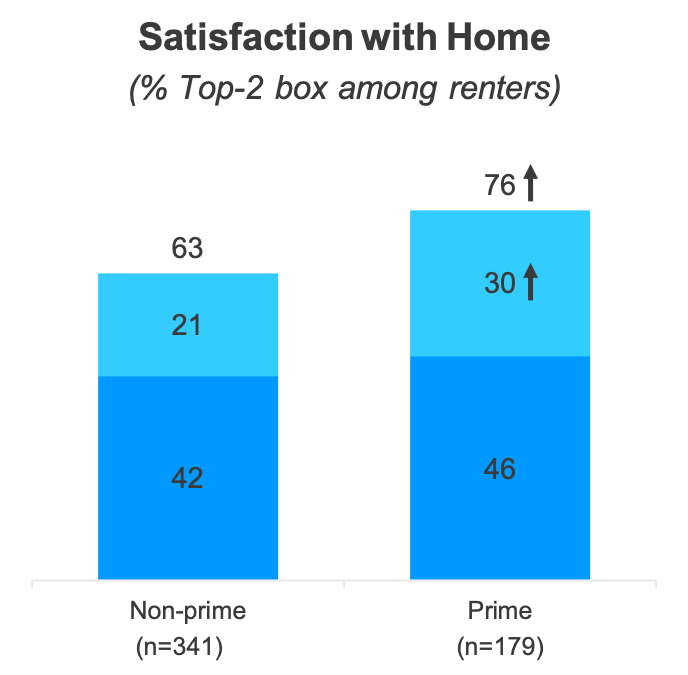
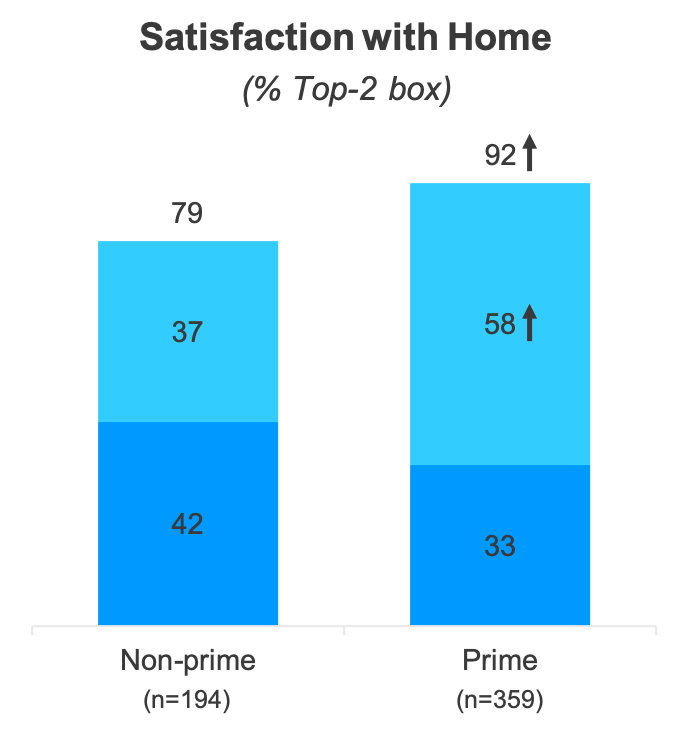
Overall, most U.S. consumers are satisfied with their current residence.
Seven out of 10 nonprime are Satisfied with their current residence.
Almost half of all prime consumers are Very Satisfied with their residence compared to just 29% of nonprime.
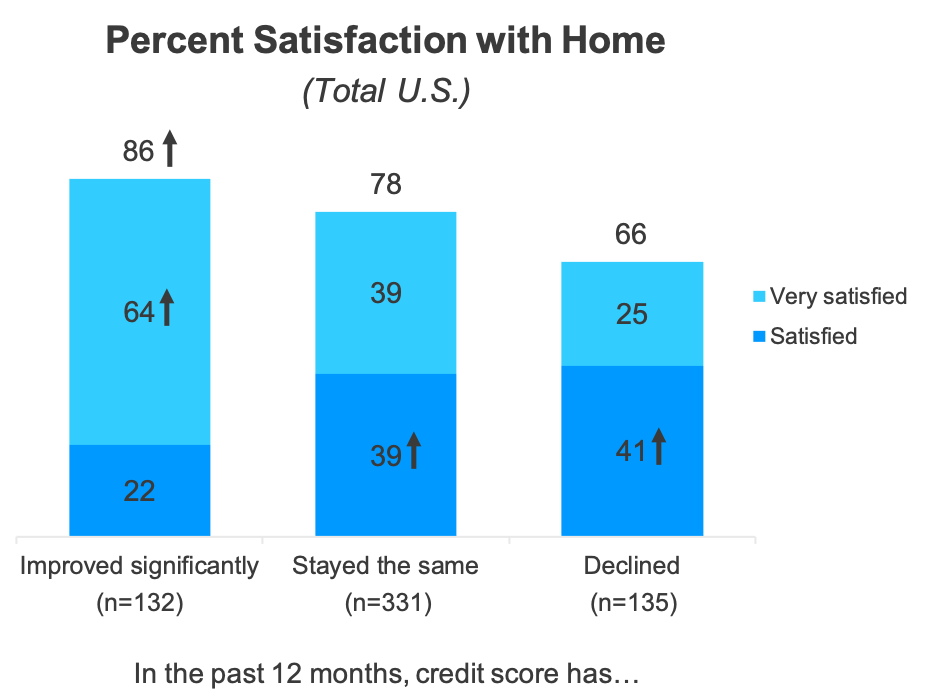
Consumers who are able to improve their credit score ‘significantly’ more likely to be satisfied with home.
Consumers who are able to improve their credit score significantly experience much higher top-box satisfaction.
Top-box satisfaction among those who improve their score significantly is 64% higher than those whose score stays the same, and 156% higher than those whose score declined.
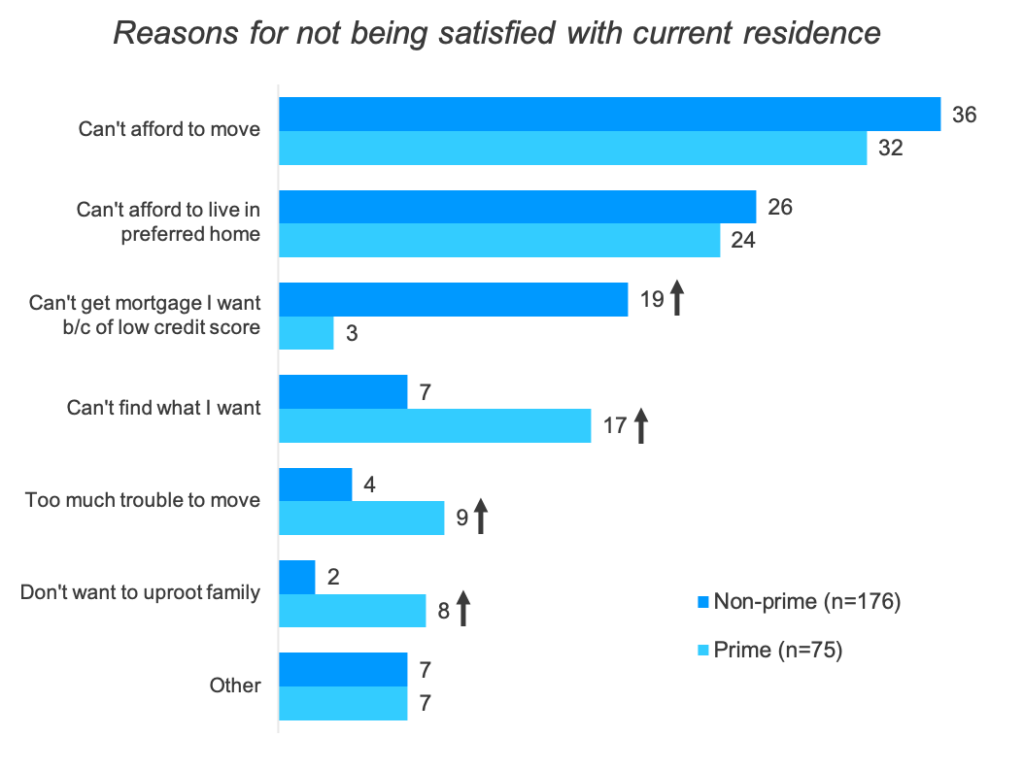
Dissatisfaction with their current residence centers on Can’t afford to move or Can’t live in preferred home.
Two out of ten nonprime consumers aren’t satisfied because they couldn’t get the mortgage they wanted due to a low credit score.
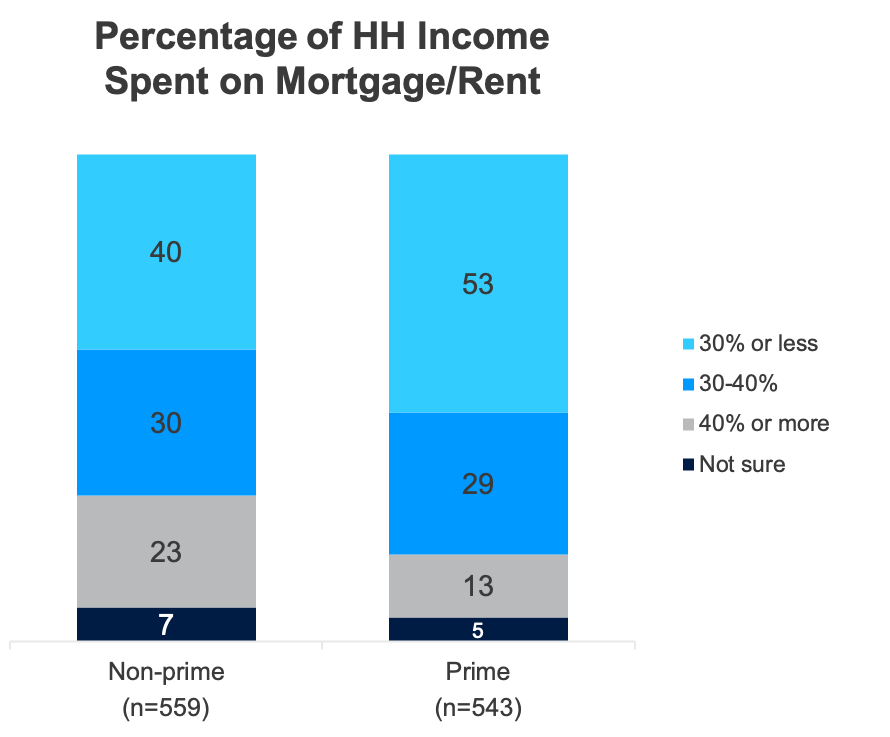
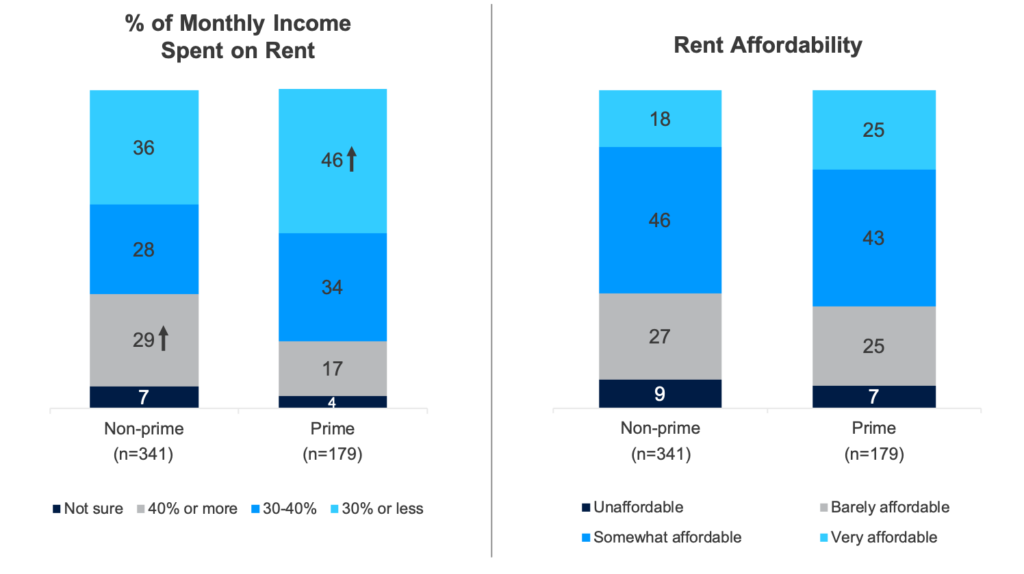
Just over half of all Prime consumers spend 30% or less of their HH income on rent/mortgage.
Rule of 28: The golden rule in determining how much home you can afford is that your monthly mortgage payment should not exceed 28% of your gross monthly income.
More than two-thirds of nonprime consumers spend more than 30% of their HH income on mortgage or rent.
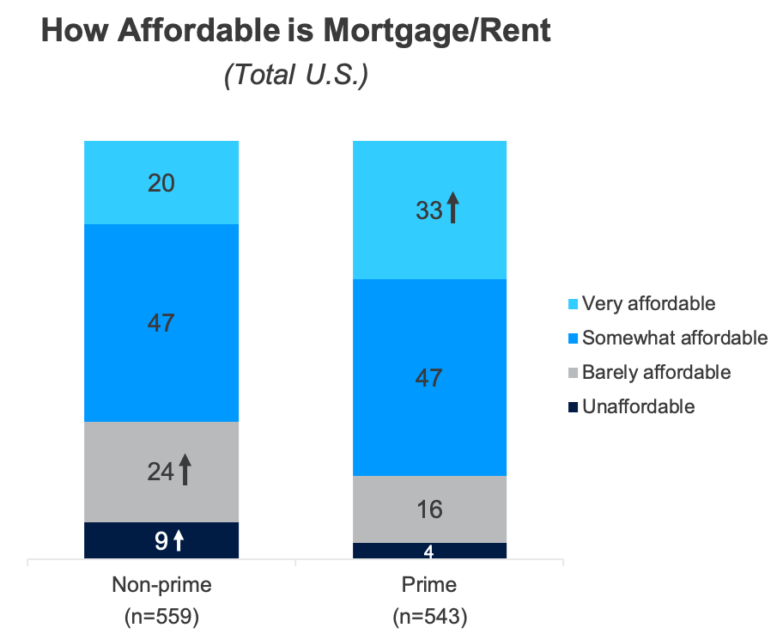
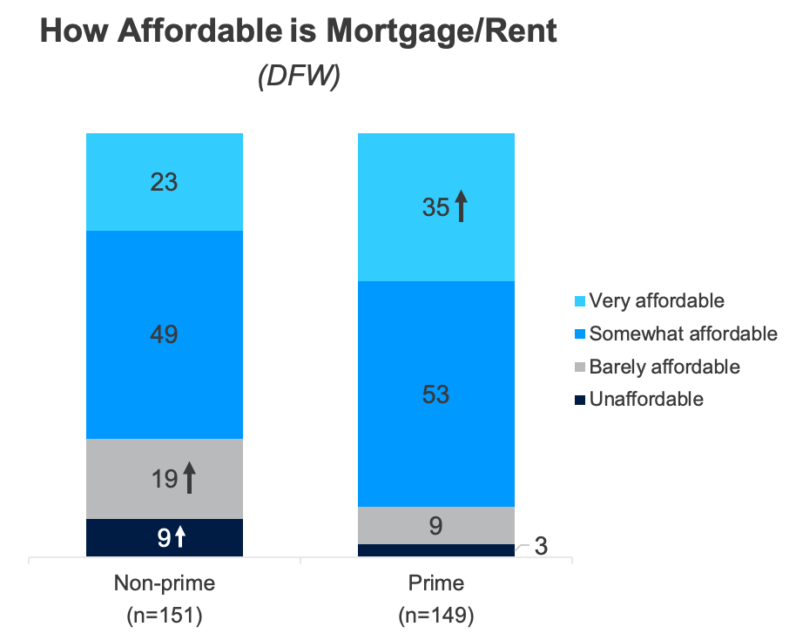
Most consumers say their mortgage/rent is Very or Somewhat Affordable.
Nonprime consumers are more likely than prime to say it’s either Barely Affordable or Unaffordable.
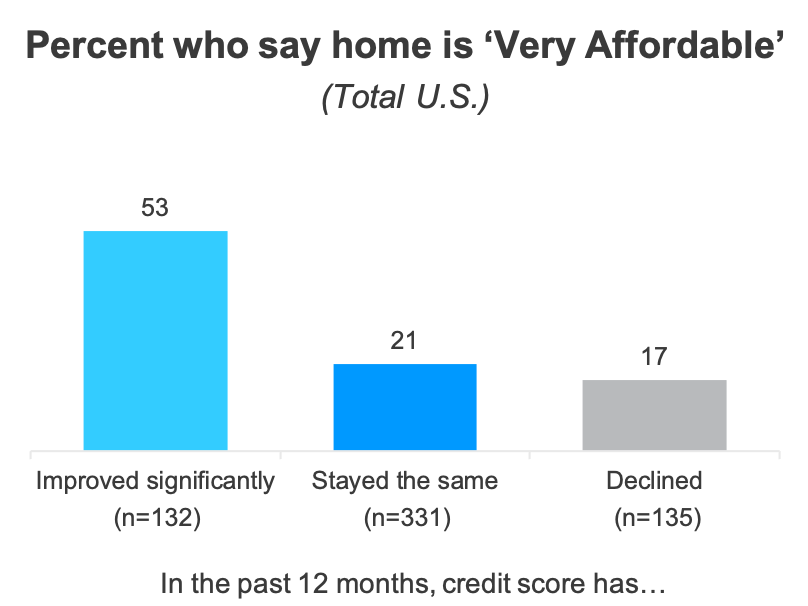
Improving credit scores significantly can improve consumers chances of having a Very Affordable home
This finding is true for both Prime and Nonprime consumers.
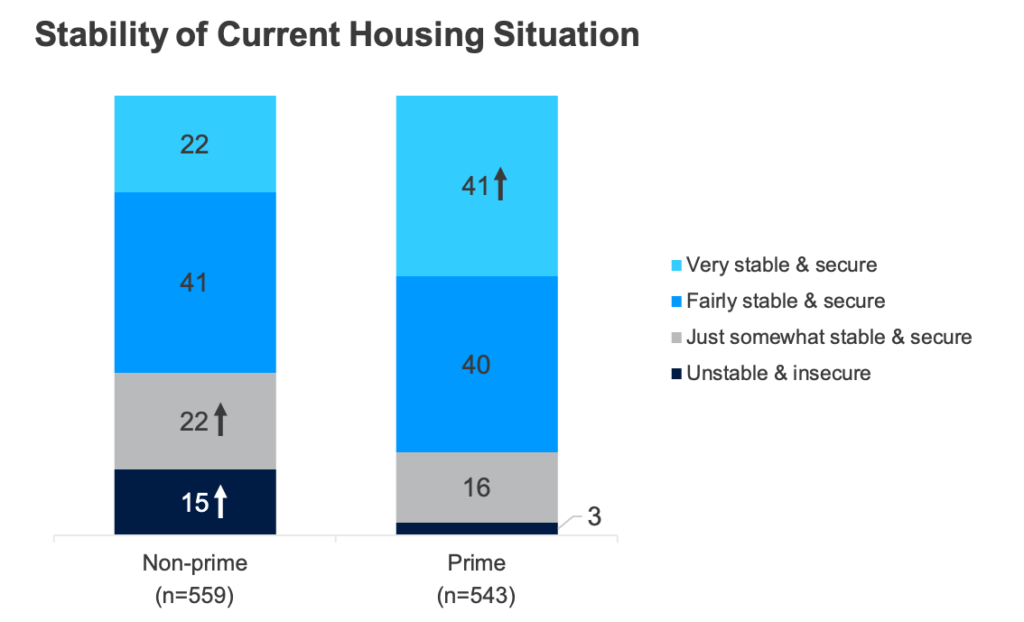
Overall, most consumers feel stable and secure in their current housing situation.
Prime consumers more likely to feel Very stable and secure, while more than a third of nonprime say they’re Just or Not stable and secure.
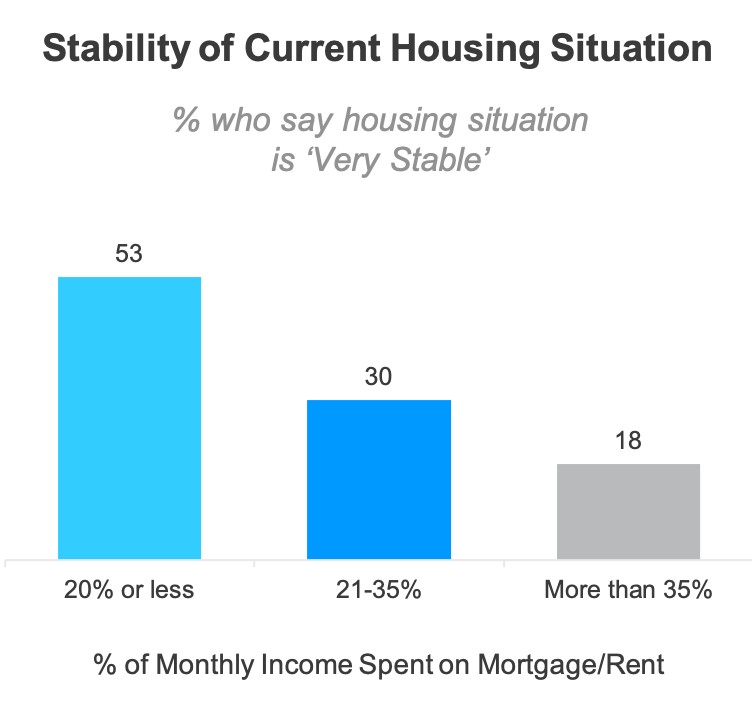
Stability of housing situation is impacted by the amount spent each month on mortgage/rent.
Households that spend a smaller percentage of their monthly income on mortgage/rent feel more stable than those who spend more.
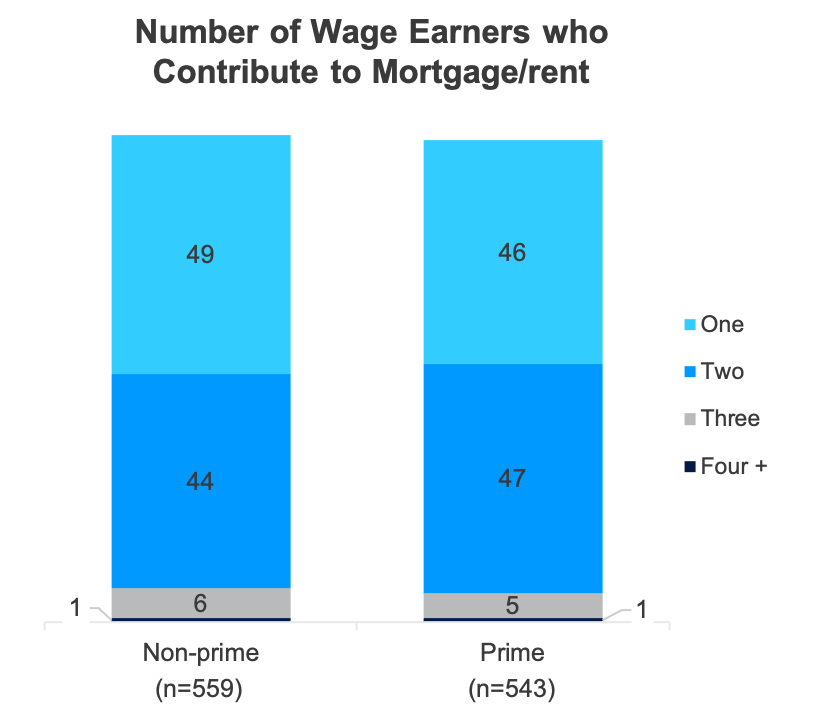
Almost half of all U.S. households have just one wage earner who contributes to mortgage or rent.
An equal percentage of HH have two wage earners.
Housing Logistics
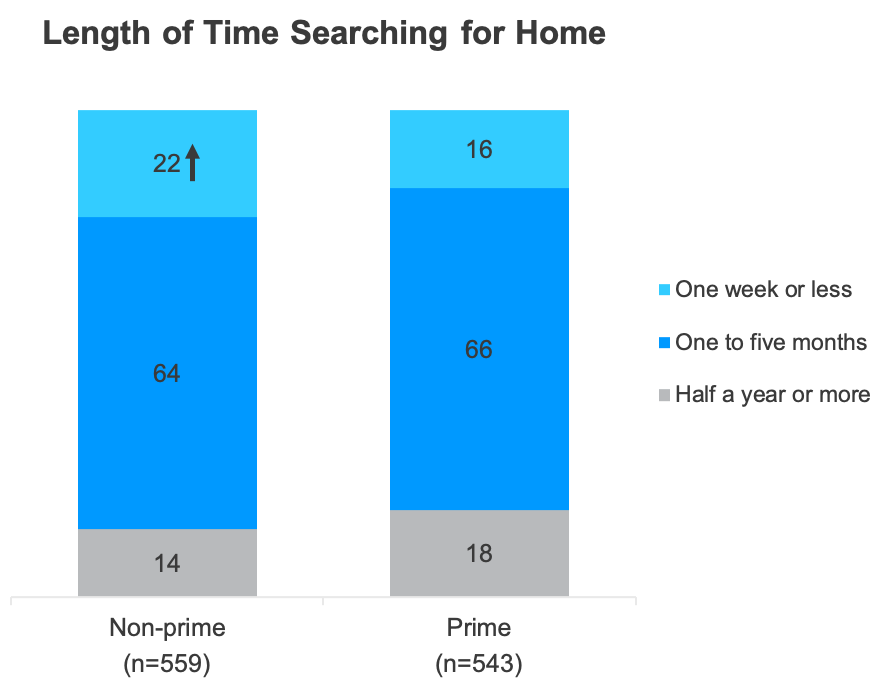
Most people, about two-thirds, spend 1-5 months searching for their home.
Nonprime consumers are 40% more likely to spend one week or less looking for a home.
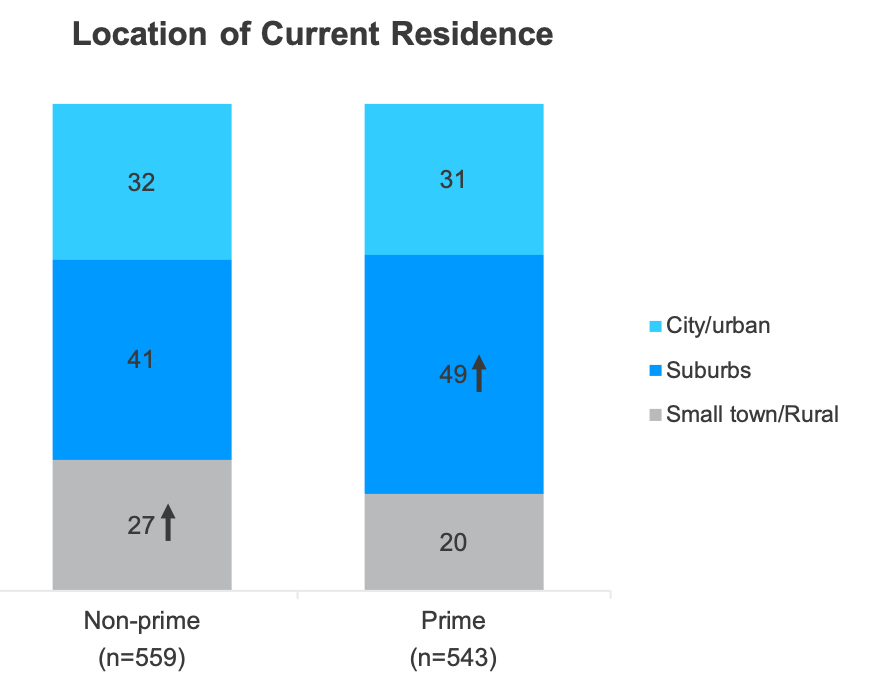
Not surprisingly most U.S. consumers live in the city or suburbs.
A quarter of all nonprime live in small towns or rural areas compared to just 17% of prime.
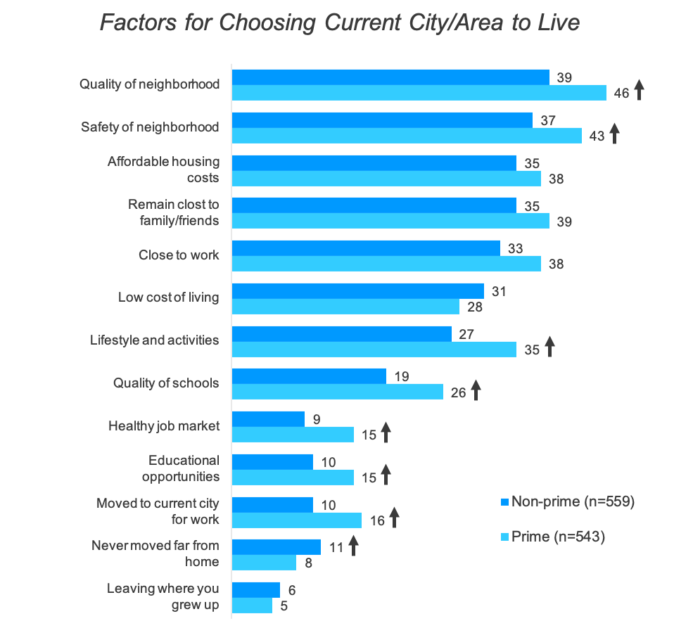
Quality and safety of neighborhoods, and affordable housing are the primary factors when choosing where to live.
In addition to quality and safety of neighborhoods, nonprime consumers are more likely to list lifestyle/activities and school quality as their primary drivers.
Renters
Most renters are satisfied with their home, with significantly more prime being satisfied than nonprime.
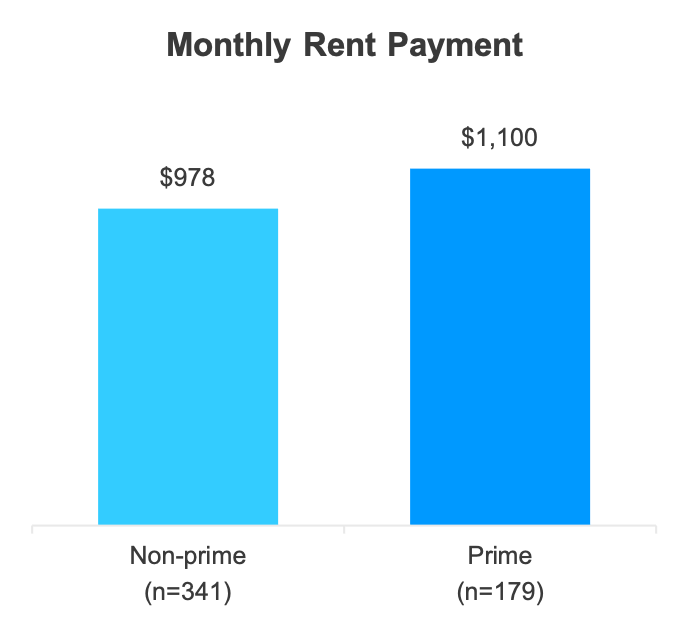
U.S. consumers spend an average of about a $1,000 on their monthly rent payment.
Nonprime consumers more likely to spend over 30% of their income on rent, but most indicate it’s affordable
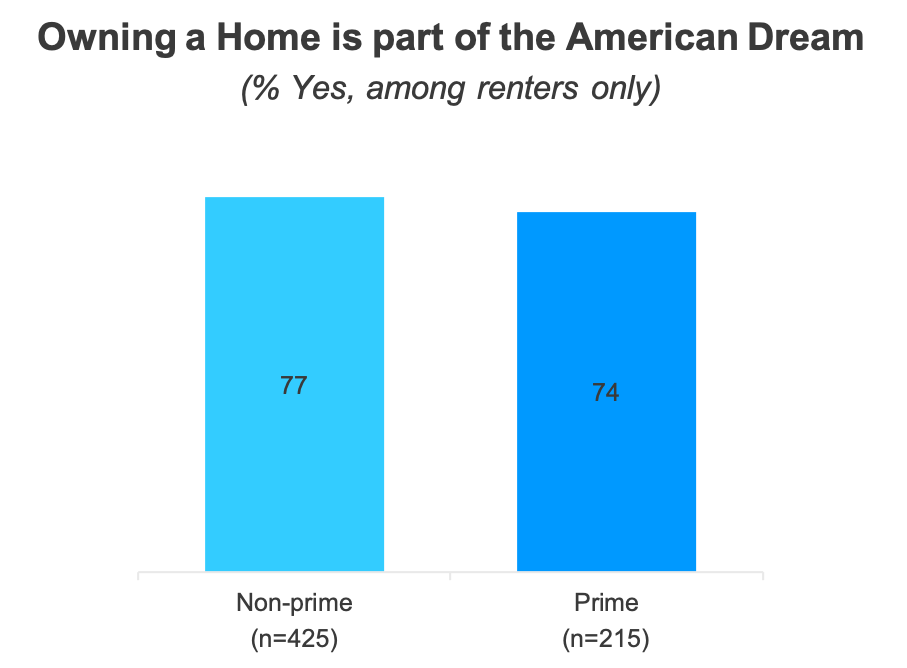
Three-quarters of renters believe owning a home is part of the American Dream.
Nonprime and prime consumers share this sentiment equally.
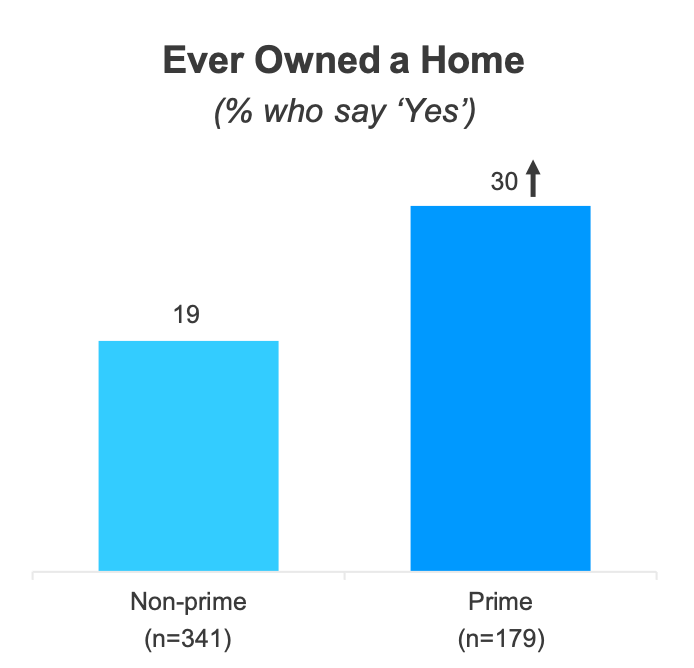
About one-quarter of renters did own a home in the past.
Prime consumers are more likely to be former home owners.
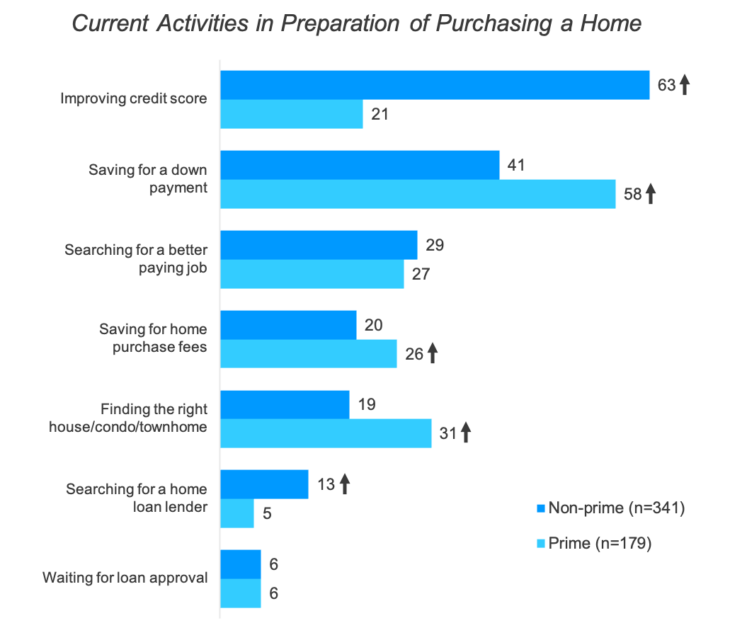
Two-thirds of nonprime consumers are working to improve their credit score before purchasing a home.
The second most frequently cited activity for nonprime is saving for a down payment, which happens to be the number one activity for prime.
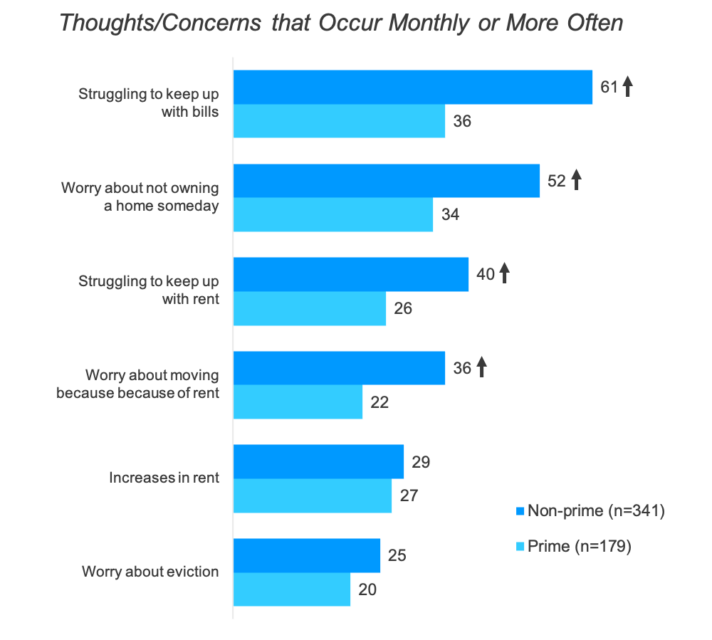
Struggling to keep up with bills and Not owning a home one day are the most frequent thoughts among renters
More nonprime renters cite these reasons compared to prime. They also worry about struggling to keep up with rent and worry about moving because of rent.
Home Owners
Almost all owners are satisfied with their home.
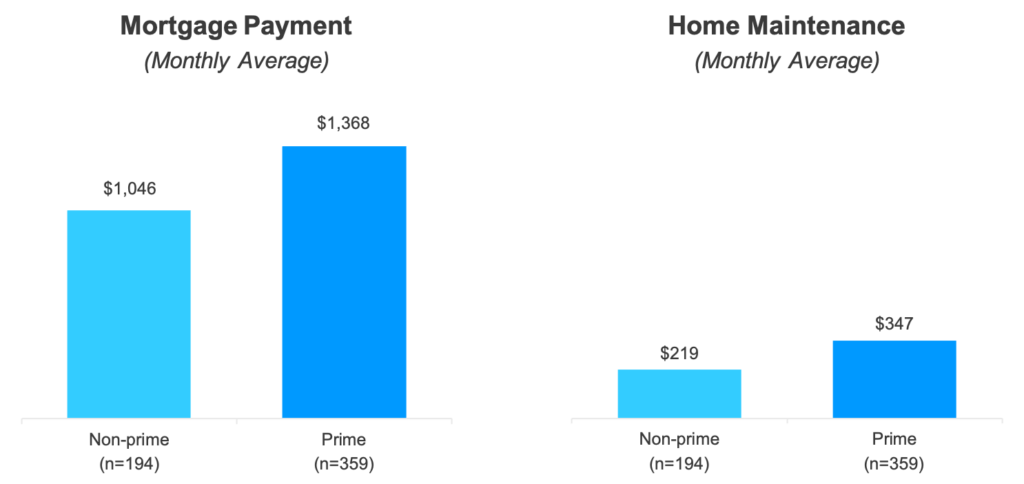
U.S. home owners spend on average over a thousand dollars a month on their mortgage, and around $300 on maintenance
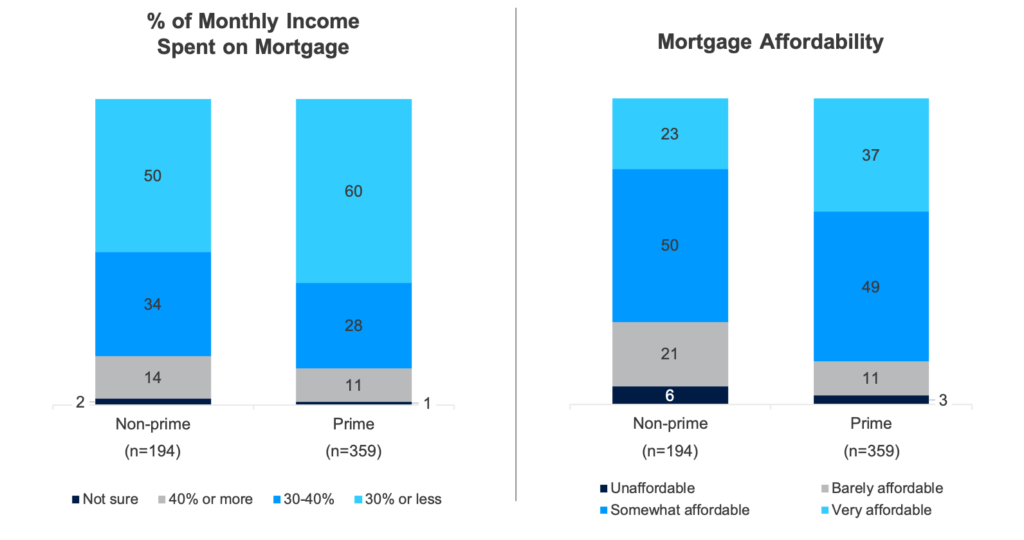
More than half of nonprime spend more than 30% on their mortgage, and a quarter say it’s barely affordable
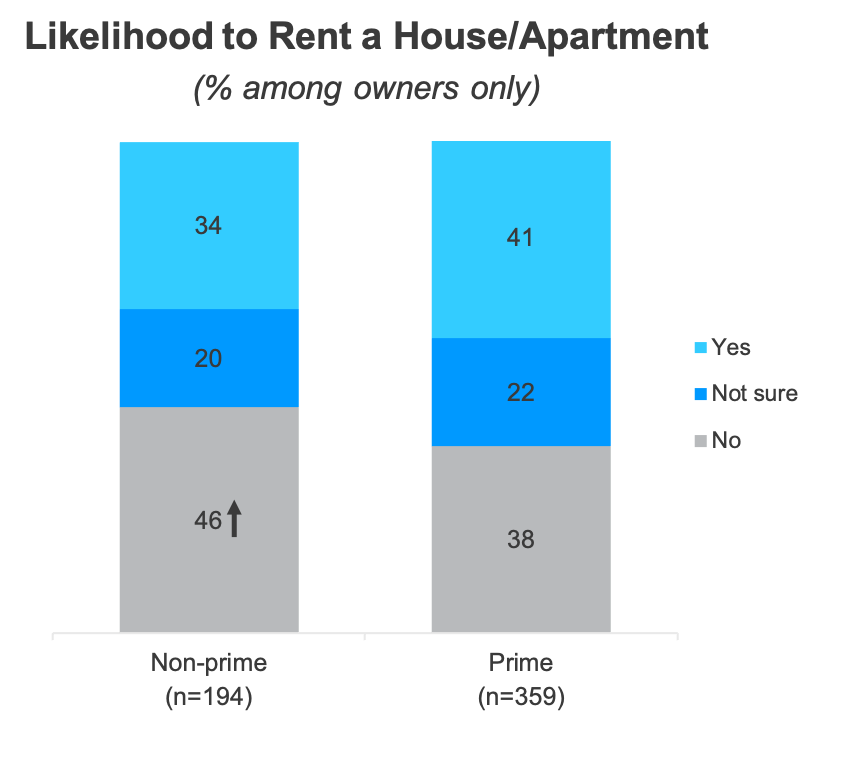
Interestingly, prime home owners are slightly more likely to consider renting in the future than nonprime.
Almost half of nonprime home owners say the would not consider renting.
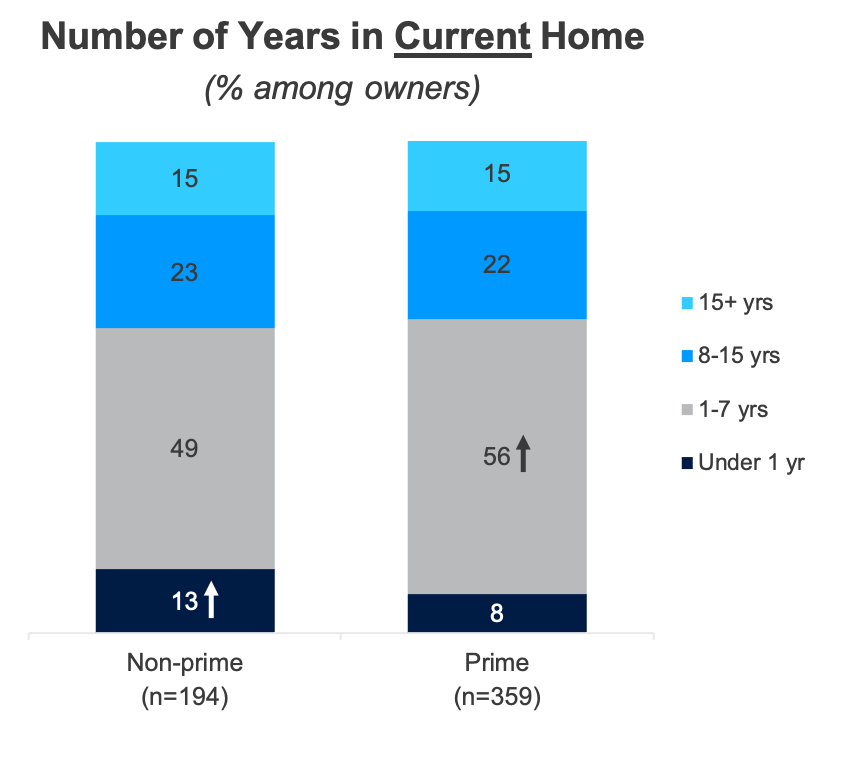
Prime tend to have been owners longer than nonprime.
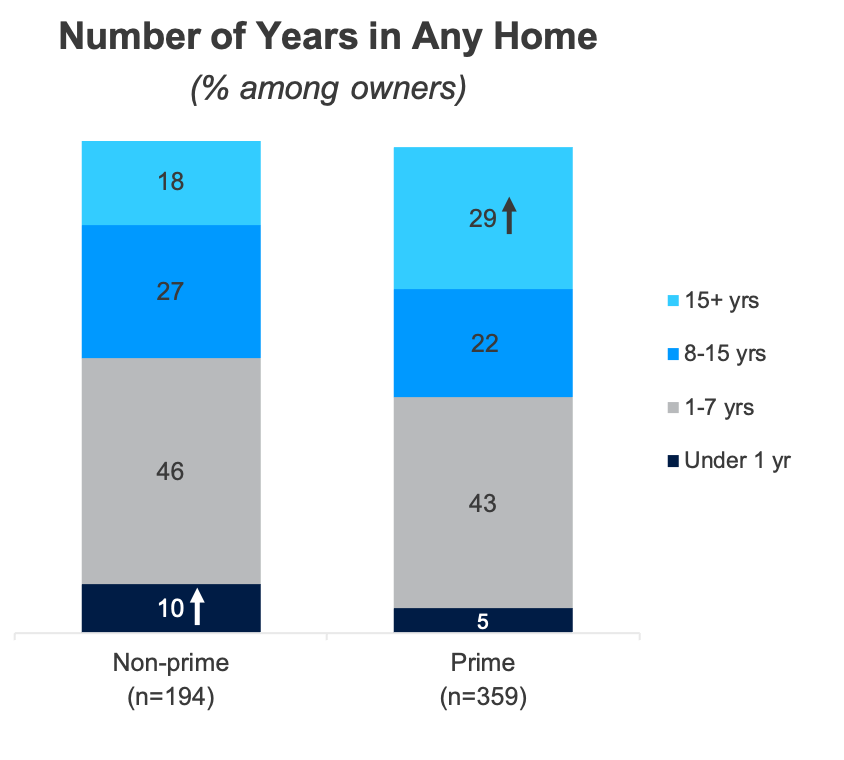
Nonprime are more likely to be relatively new in their current home.
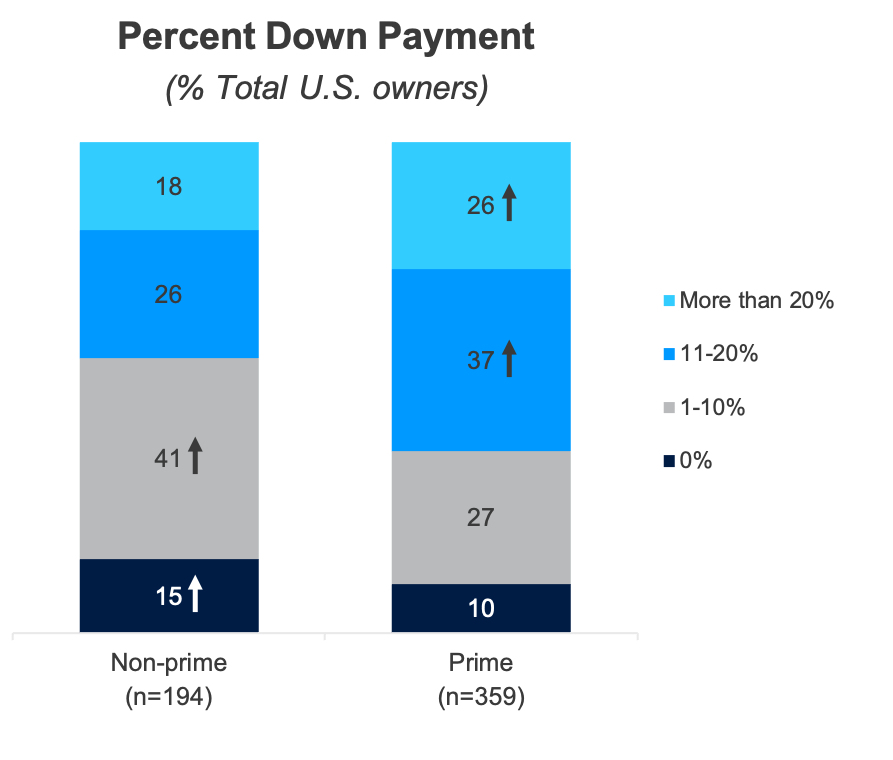
Nonprime consumers tend to put less money down than prime.
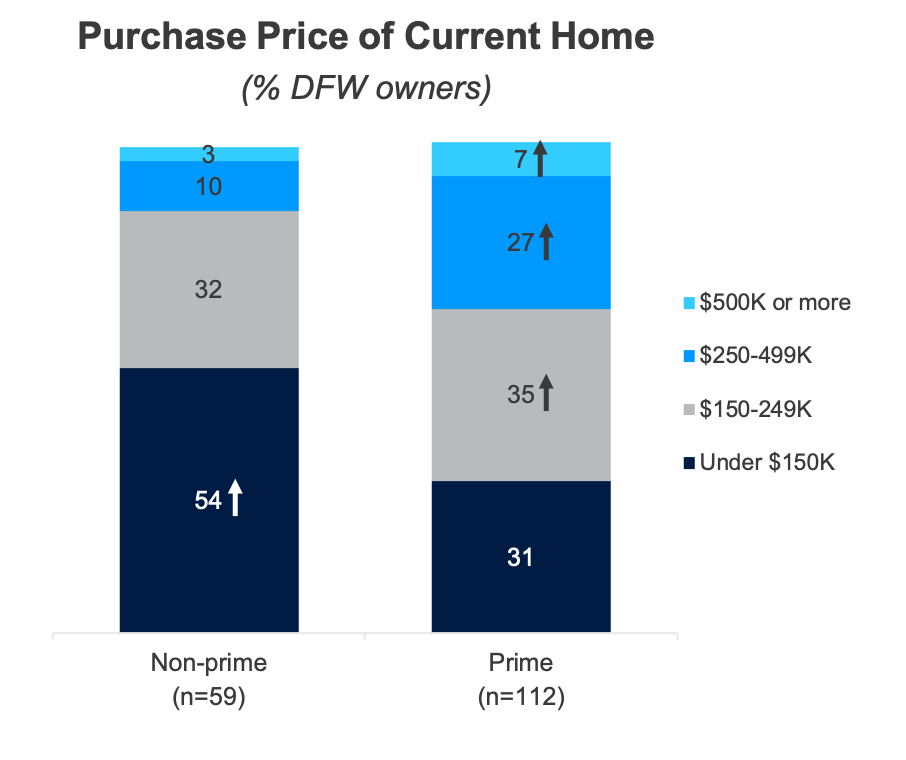
Purchase price among prime consumers tends to be higher than what nonprime spend.
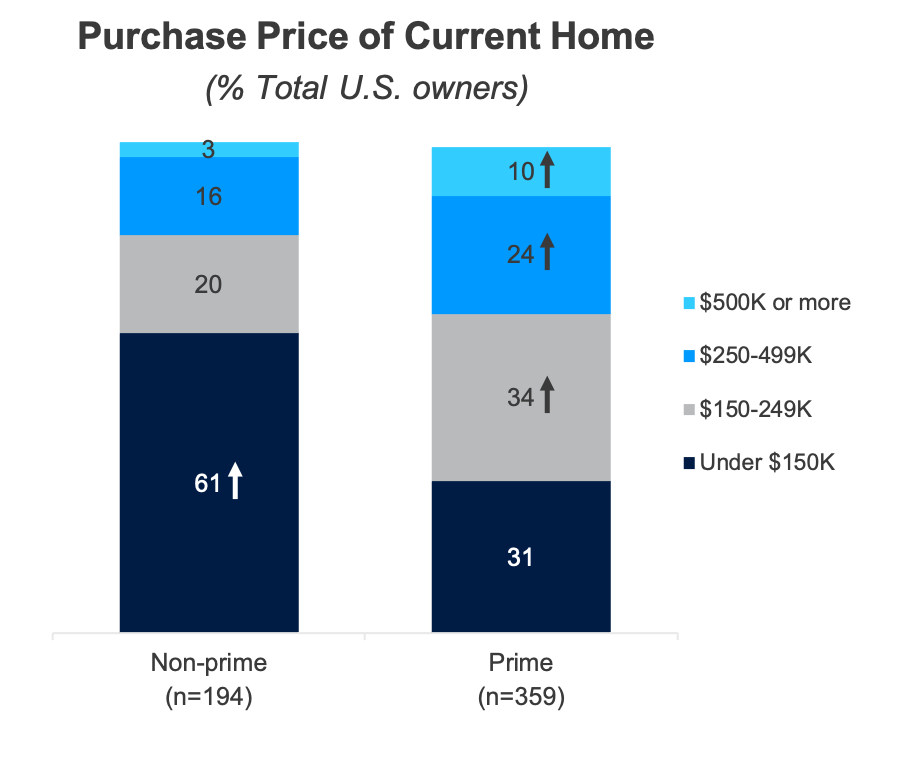
Purchase price among prime consumers tends to be higher than what nonprime spend.
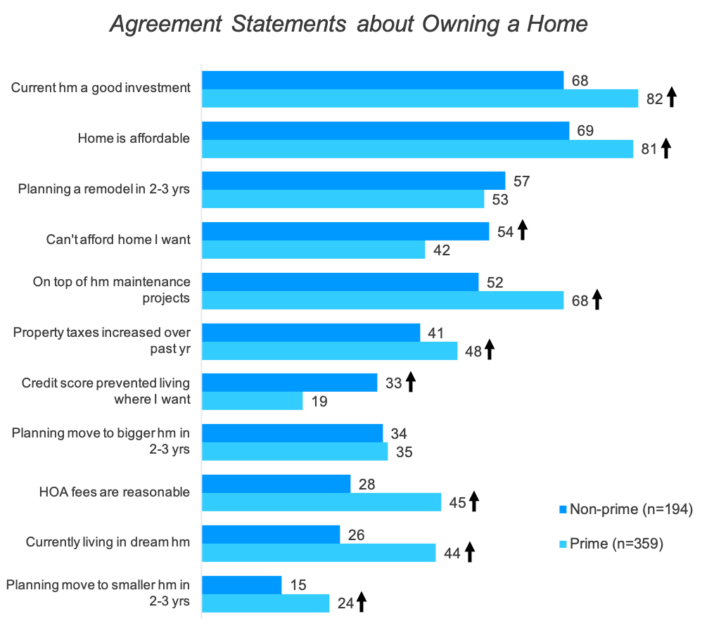
Most home owners say it’s a Good Investment.
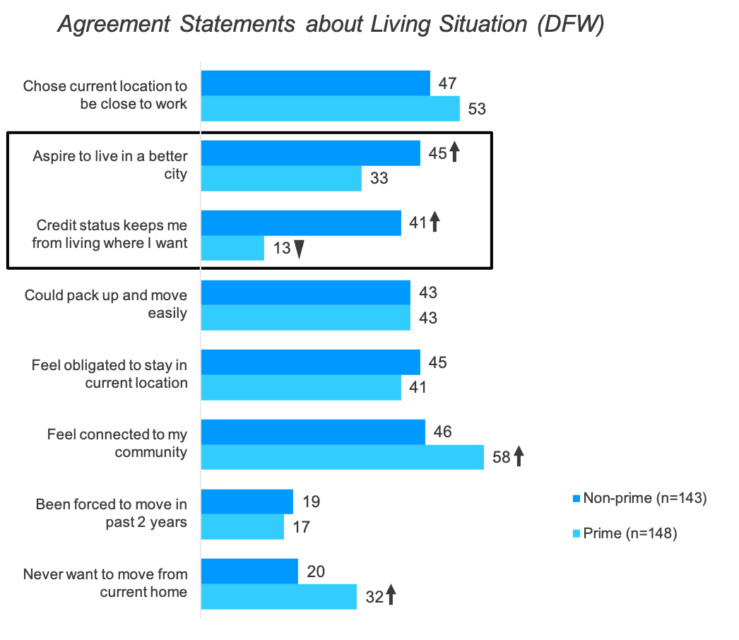
Almost half of nonprime say they can’t afford the home they want, and a third agree that their credit score prevented them from living where they want.
General Financial Status
Nonprime consumers have higher agreement with statements about affordability or outgrowing their home.
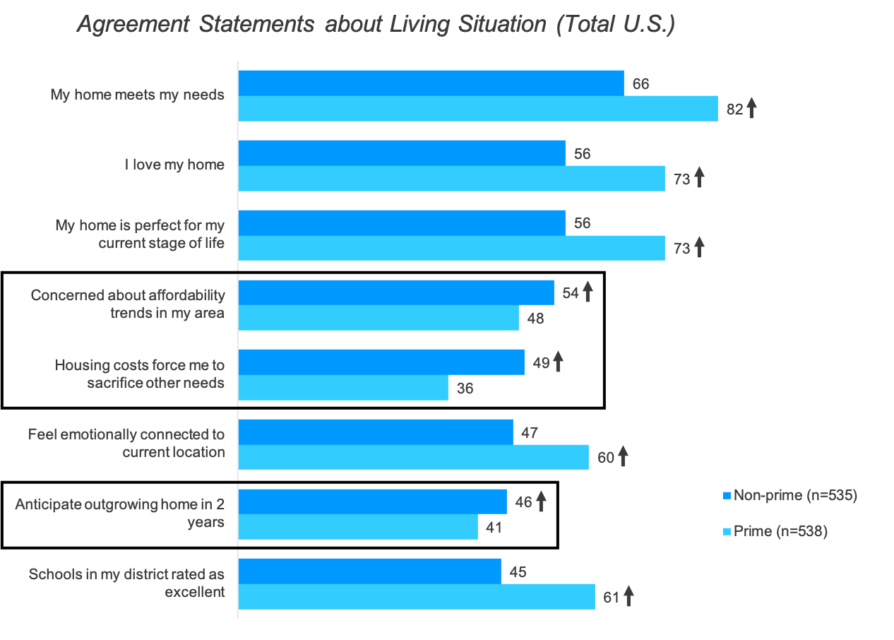
Nonprime consumers have higher agreement with statements about affordability or outgrowing their home.
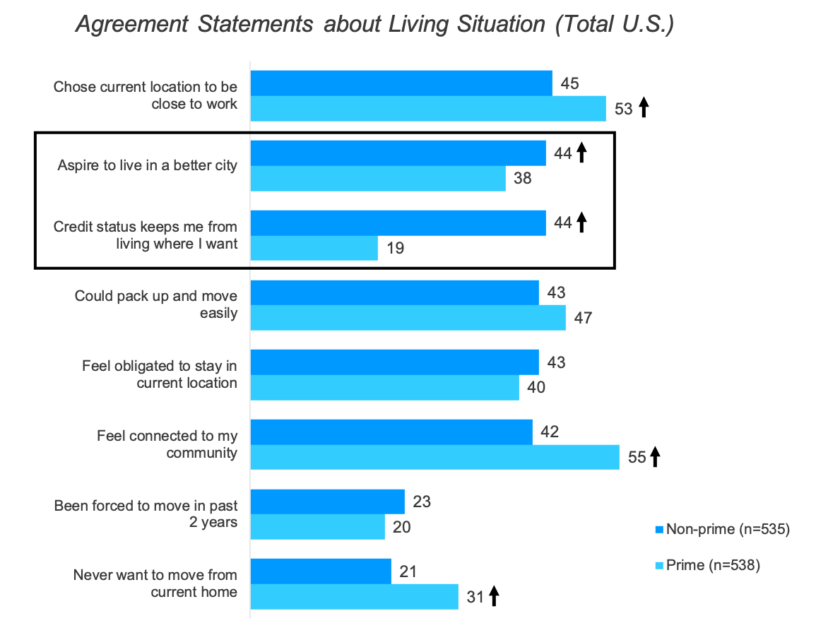
Nonprime consumers have higher agreement with statements about affordability or outgrowing their home.
Nonprime consumers have higher agreement with statements about affordability or outgrowing their home.
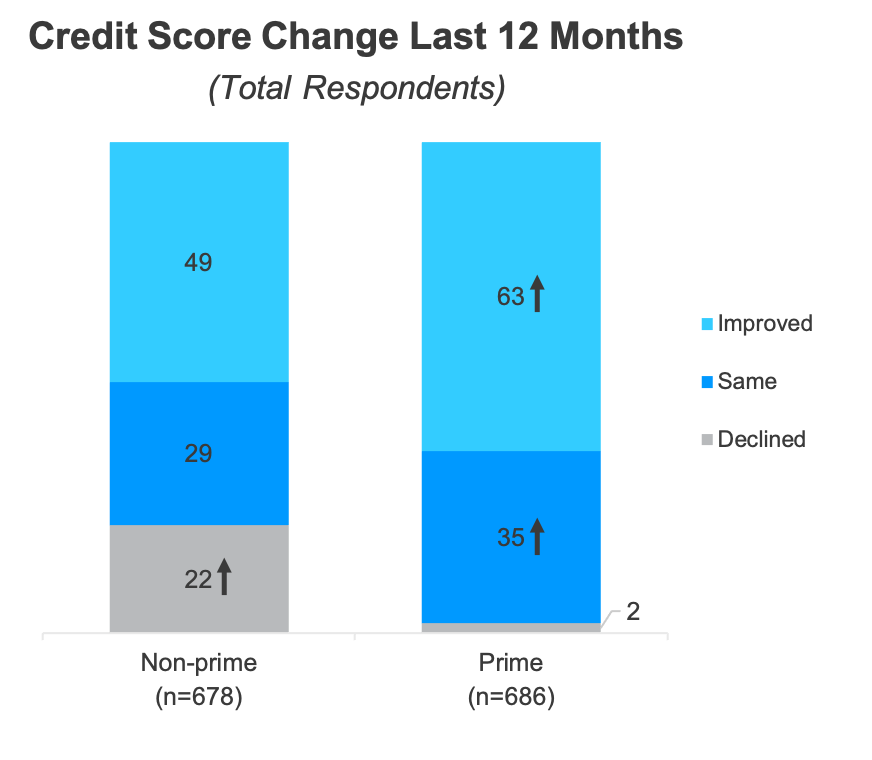
Nonprime more likely to say their credit score declined in the last 12 months.
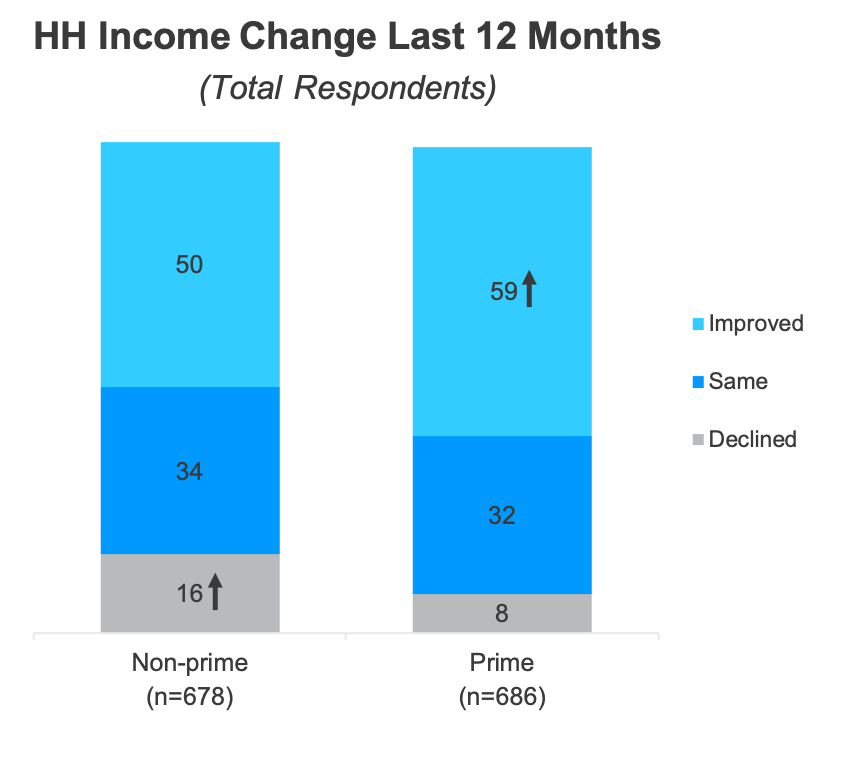
Nonprime also more likely to say their HH income declined, but half did say it improved.
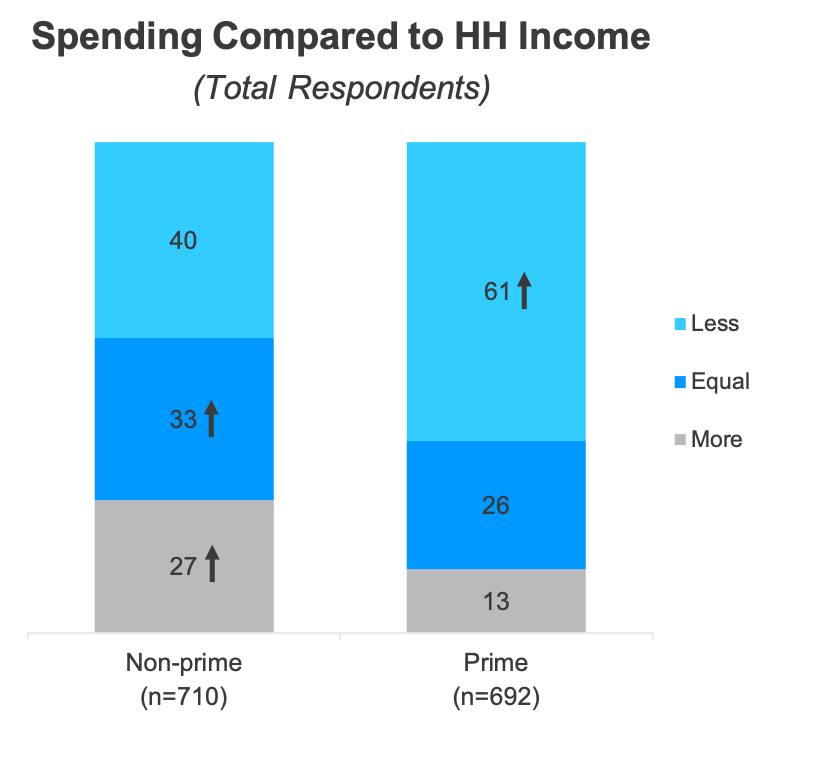
Nonprime spending either equal or more than what their income brings.
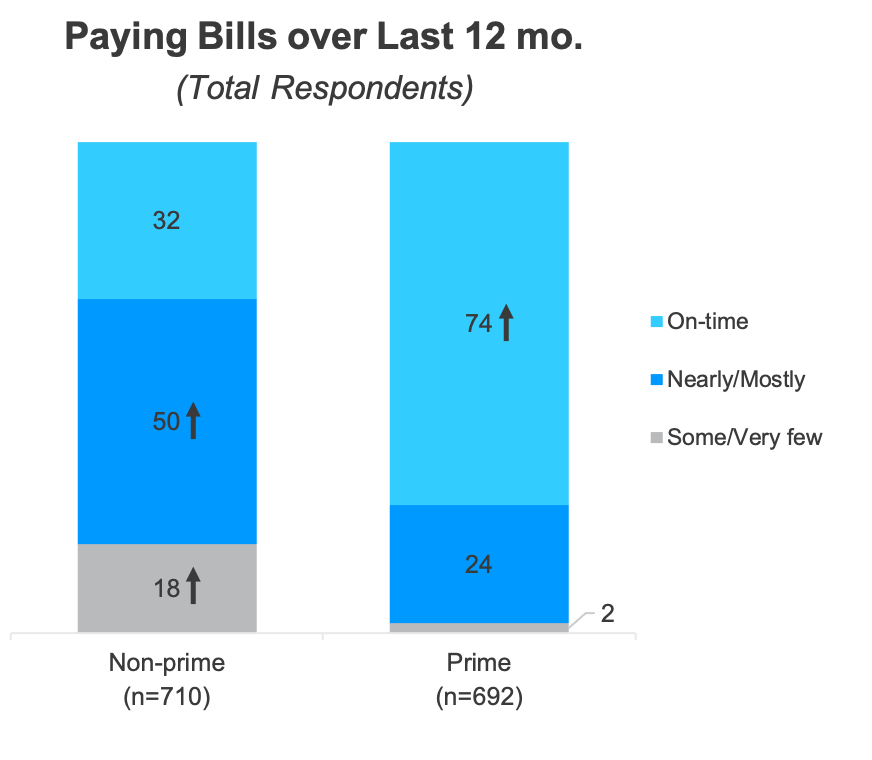
Nonprime not able to pay bills on time compared to prime.
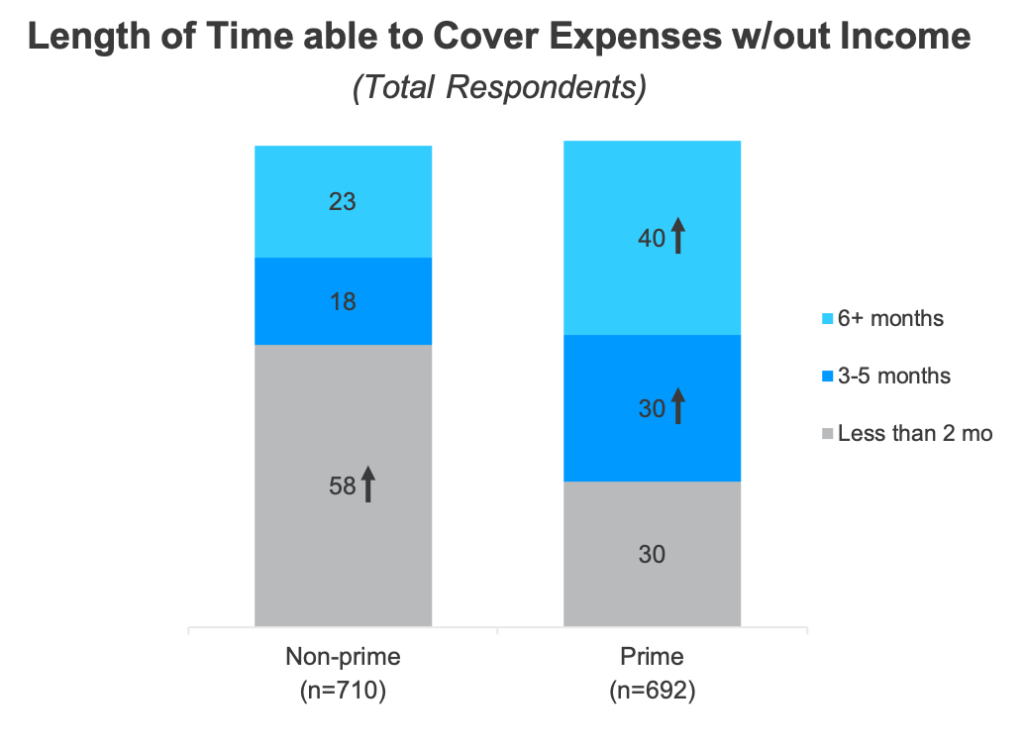
Most nonprime can cover current spending expenses for only 2 months or less in the absence of income.
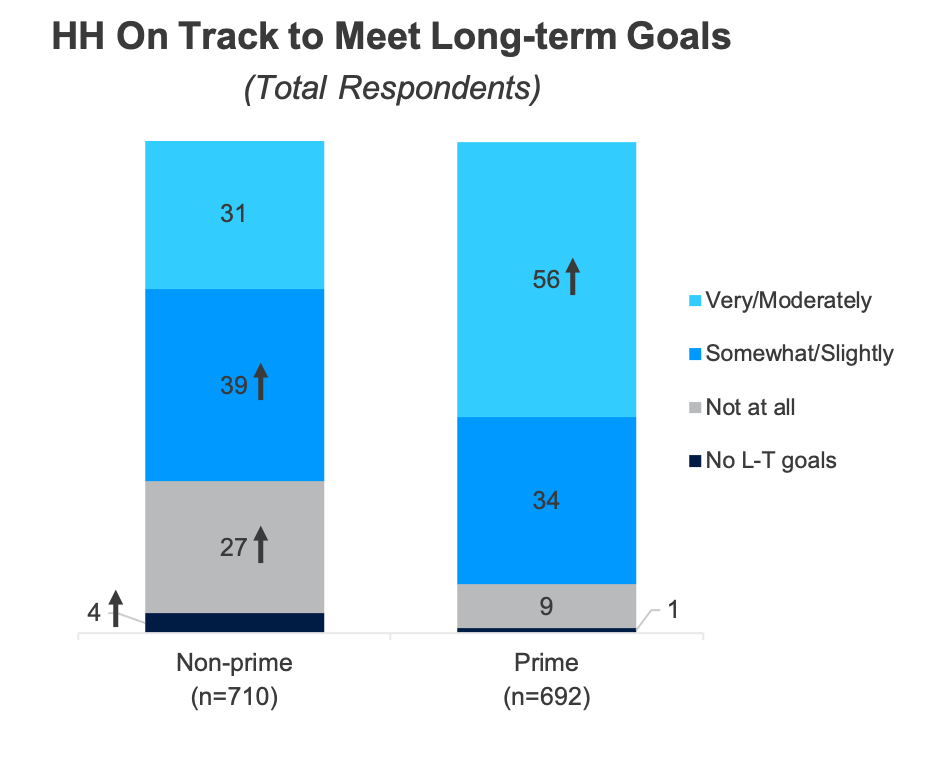
Most nonprime are not completely confident in meeting their long-term financial goals.
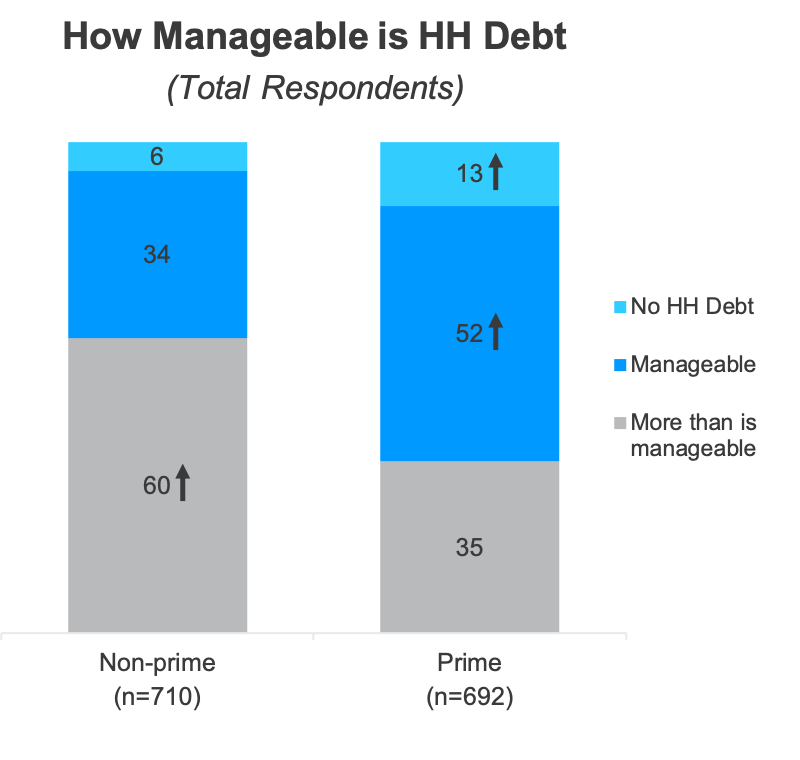
About 6 out of 10 nonprime say the have more debt than is manageable.
Methodology
The primary purpose of this study was to determine how non-prime consumers were similar or different from those with prime credit when it came to spending during the holidays.
Interview Dates: January 17 – 22, 2020
Sample Specs: •Total Consumers = 1,402 (Non-prime = 710; Prime = 692) •Sample Source: Research Now Consumer Panel
Qualification Criteria: •Ages 18-64 •HH income: Over $25K •Geography – U.S. Rep •Has primary or shared responsibility managing HH finances
Survey Instrument: online questionnaire
About
About Elevate’s Center for the New Middle Class
Elevate’s Center for the New Middle Class conducts research, engages in dialogue, and builds cooperation to generate understanding of the behaviors, attitudes, and experiences of America’s growing “New Middle Class.”
For more information, visit: www.elevate.com/NewMiddleClass
Contact
NewMiddleClass@elevate.com
@NewMidClass
Facebook.com/NewMiddleClass