August 2018
Introduction
The broad discussion in many circles about the plight of the non-prime consumer often uses assumptions about how these consumers think, what matters to them, and even what would be good for them. However, there is limited data that really explains their circumstances.
Elevate’s Center for the New Middle Class seeks to understand the differences in attitudes, experiences and behavior between consumers with prime credit and those with non-prime credit.
This study represents results from a survey of 1,019 U.S. consumers (514 with non-prime and 505 with prime credit scores). Interviews were conducted in June 2018 to learn about how undergraduate students pay for college.
Non-prime Americans
“Non-prime Americans” represent the New Middle Class. These are Americans with a credit score below 700, meaning that their access to credit is limited or curtailed. Non-prime is also often further divided into “near prime,” “sub-prime,” and “deep sub-prime.”
It is the Center’s objective to better understand non-prime experiences, attitudes, and behavior.
The following report seeks to understand the financial implications of prime and non-prime consumers’ ability to cover their child’s college expenses.
Executive summary
•Students from non-prime households are more likely to attend public, community, or junior colleges compared to students from prime households.
•Consequently, they are more likely to live at home.
•The majority of these students come from single-parent or homes with a step-parent.
•Compared to prime parents, non-prime parents are significantly more likely to say that financial aid affected their choice of schools.
•Non-prime parents are slightly more sensitive to schools welcoming students from diverse economic backgrounds.
•Students from non-prime families are extremely reliant on financial aid as nine out of ten will use some form of financial assistance to cover college expenses in the Fall 2018, compared to three-quarters of prime students.
•Access to financial aid is critical for these students because most of them come from single-income households with fluctuating incomes where their parent’s financial situation is precarious and burdened with high levels of debt.
Attending College
Type of University/College Attended
Students from non-prime households are more likely to attend Public, Community or Junior colleges. A little over one-third of students from non-prime households attend a Public University.
Almost twice as many non-prime students, 42%, attend public/community/jr colleges compared to prime students, 23%.
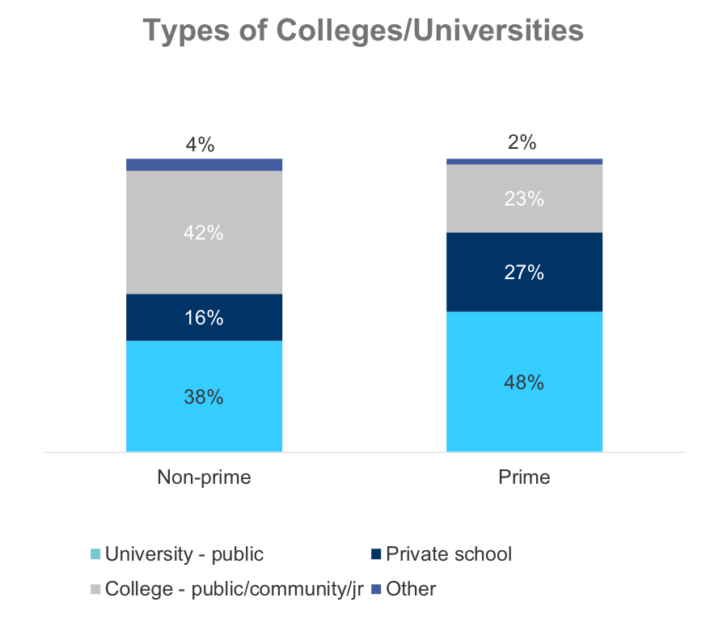
Q1. What type of college or university will your child or dependent be attending in the Fall of 2018?
Prime n=505, Non-prime n=514
Student Living Situation Prior to College
Only four out of ten college students who come from non-prime households lived with both birth parents prior to starting college.
The remaining 60% of students from non-prime households come from single-parent, live with step-parents, or live with another relative. (not graphed)
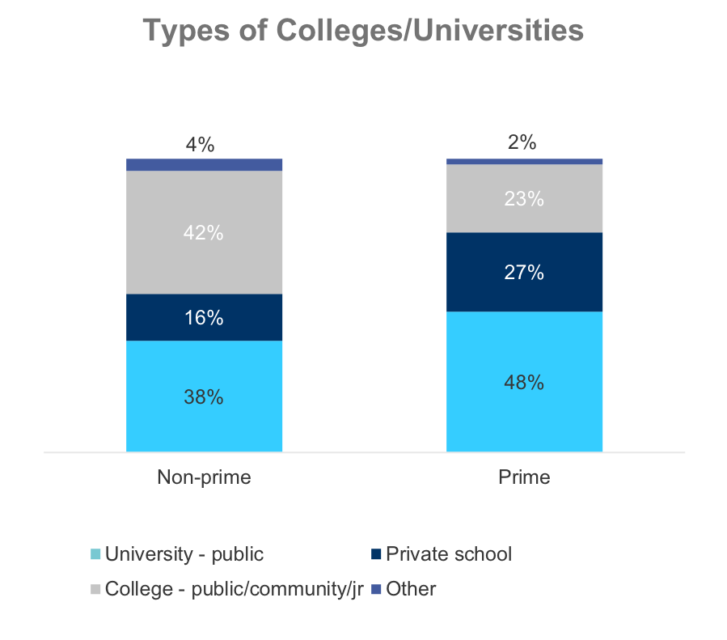
S7. Which of the following best describes your child’s or dependent’s living situation before they entered college? Prime n=505, Non-prime n=514
Student’s Year in College
Only one-third of students from non-prime households will be entering their third or fourth years, compared to one-half of students from prime households.
Significantly more students from non-prime households, 42%, will be first-years compared to only 26% of students from prime households.
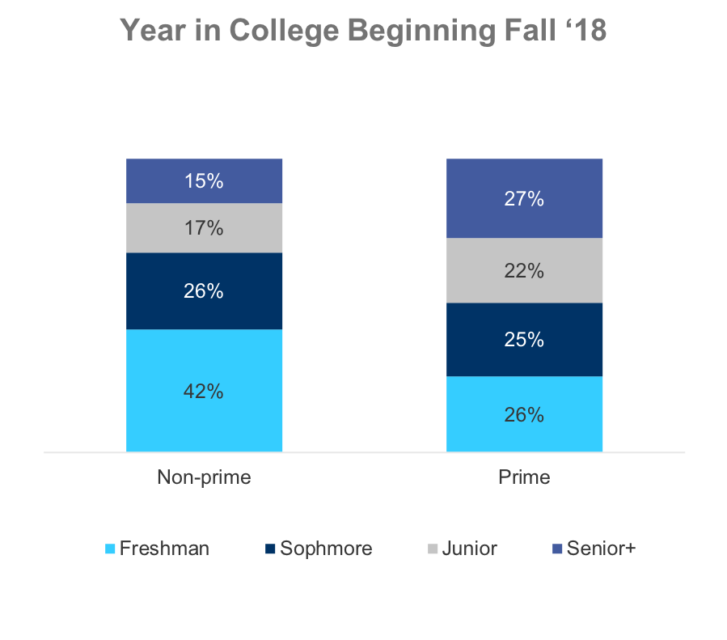
Q15. Beginning in the Fall 2018, what will your child’s or dependent’s year be in college?
Prime n=505, Non-prime n=514
Student’s Year in College
If students from non-prime households have access to loans during their entire tenure of school, their progress mirrors that of students from prime households.
However, there’s a significant percentage of students from non-prime households who do not progress past their first year if they don’t have access to loans.
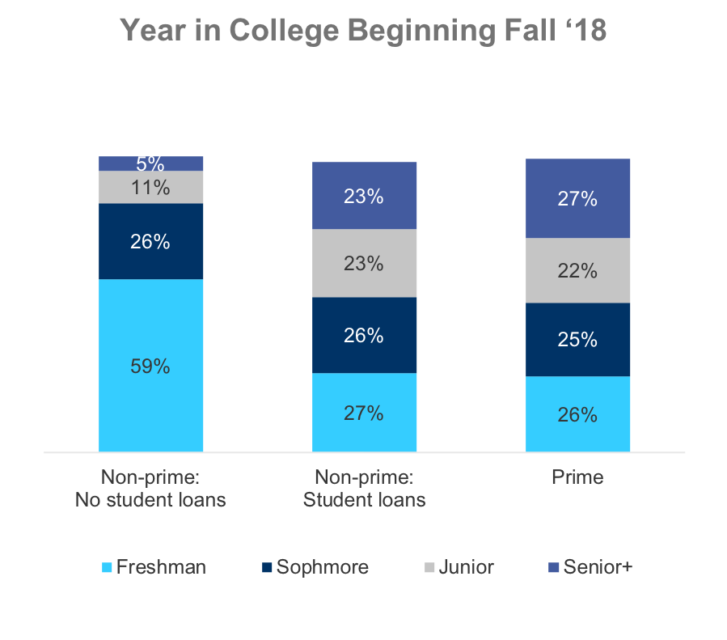
Q15. Beginning in the Fall 2018, what will your child’s or dependent’s year be in college?
Prime n=505, Non-prime n=514
Residence Location for Fall’18
Exactly one-half of students from non-prime households will live at home when classes start in Fall’18 compared to only one-third of students from prime households.
Given higher utilization of public and community colleges by students from non-prime households this makes sense.
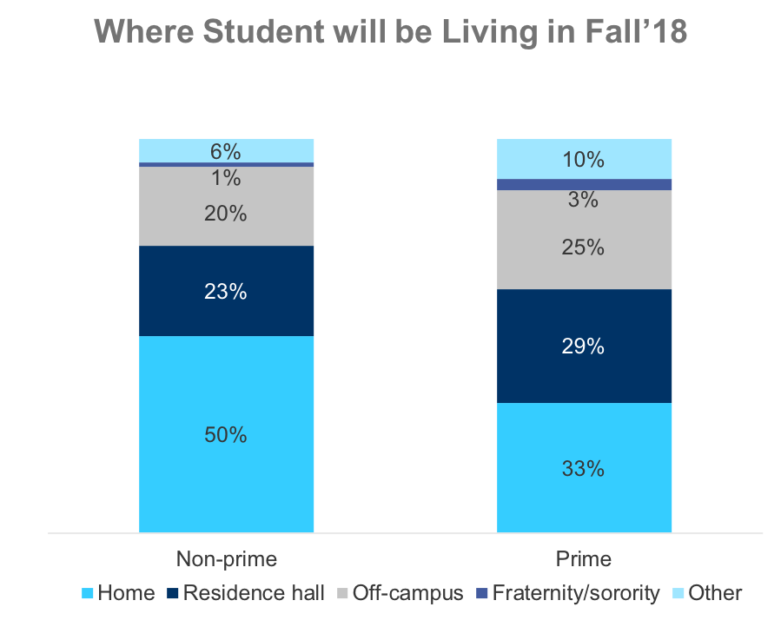
Q16. Where will your child or dependent live beginning in the Fall 2018?
Prime n=505, Non-prime n=514
Economic Diversity Driving School Choice
Compared to prime parents, non-prime parents are slightly more sensitive to schools welcoming students from diverse economic background and significantly more likely to say that financial aid affected their choice of schools.
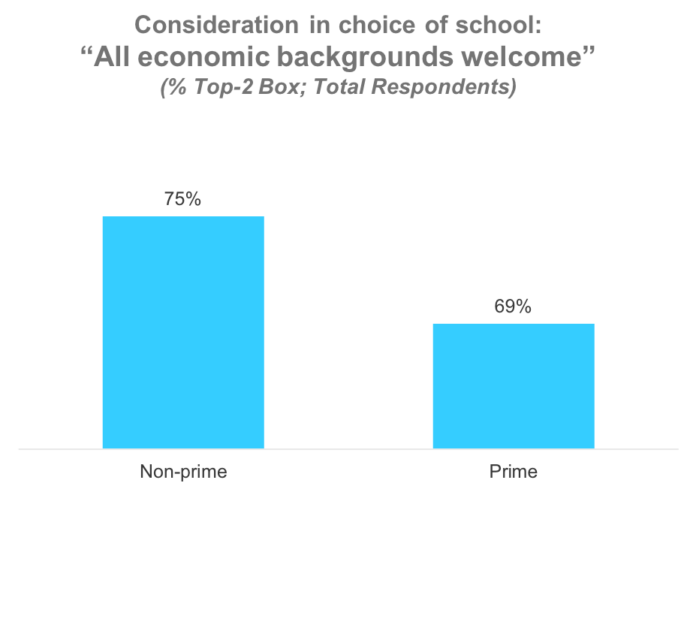
Q18. Please tell us how much you agree or disagree with the following statements?
Prime: n=505 Non-prime: n=514
Concerns for the Future Drive School Choice
Not surprisingly, most parents cite worries about the child’s future in the school choice decision. Still, non-prime parents worry even more, with almost three-quarters focused on the opportunities their child will have.
Non-prime consumers are more likely to say they feel their child will have better opportunities than they did.
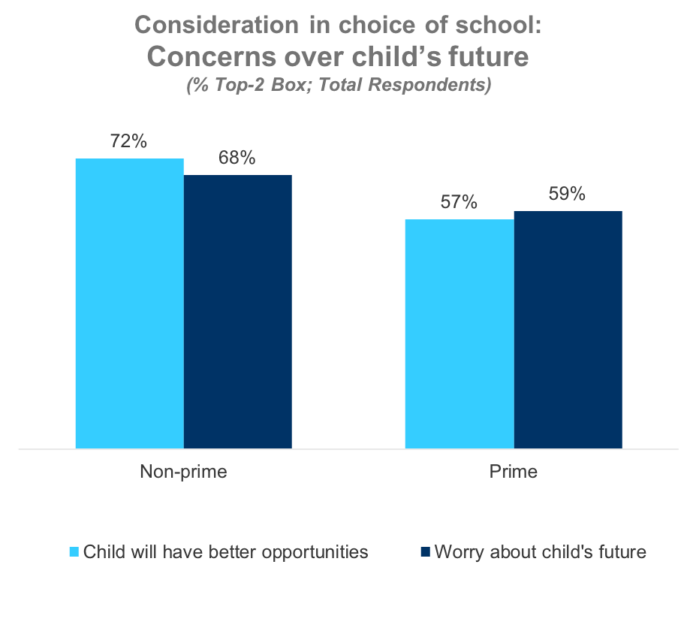
Q18. Please tell us how much you agree or disagree with the following statements?
Prime: n=505 Non-prime: n=514
Finances Affect Non-prime Choice
Non-prime parents were significantly more likely to say that finances drove school choice decisions. Two-thirds of non-prime parents said that where their child could get financial aid affected their choice.
More than half of non-prime parents worried about the acquisition of debt and nearly half worried about whether it would be difficult to pay the tuition.
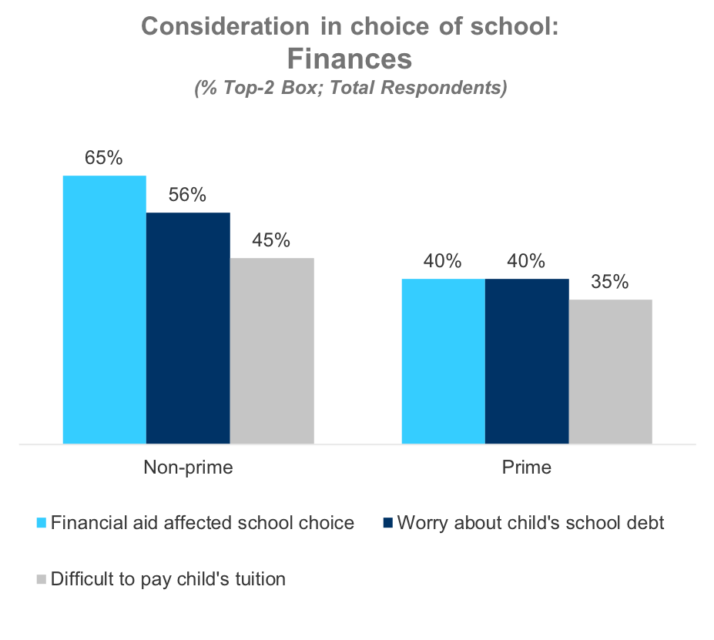
Q18. Please tell us how much you agree or disagree with the following statements?
Prime: n=505 Non-prime: n=514
Satisfaction with School’s Financial Aid
About two-thirds of non-prime families are satisfied with their college’s financial aid office, and only 6 out of 10 are satisfied with the award they received.
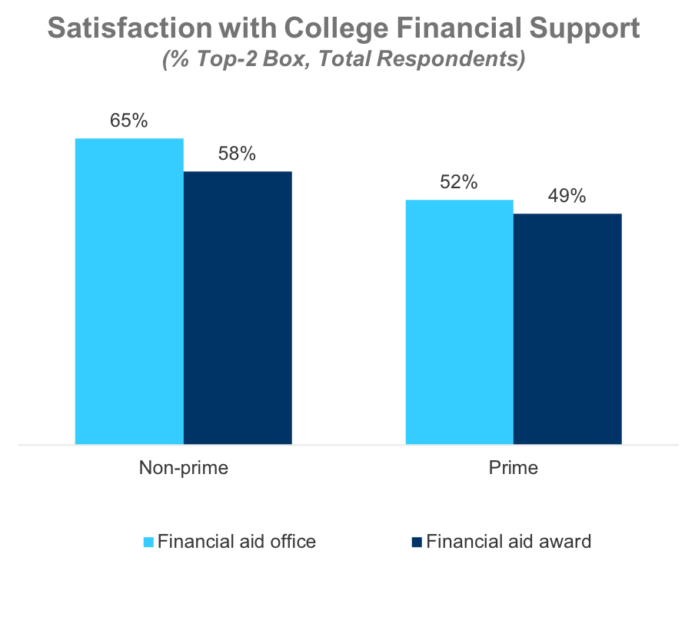
Q17. As a parent, how satisfied are you with each of the following aspects of your child’s or dependent’s college/university? Prime: n=505 Non-prime: 514Q17. As a parent, how satisfied are you with each of the following aspects of your child’s or dependent’s college/university? Prime: n=505 Non-prime: 514
Q17. As a parent, how satisfied are you with each of the following aspects of your child’s or dependent’s college/university? Prime: n=505 Non-prime: 514
Covering College Expenses
Cost to Attend College in 2018/2019
Students from prime households spend about 20% more annually on costs related to attending college. These higher costs aren’t surprising given that more of these students attend public and private universities compared to students from non-prime households.
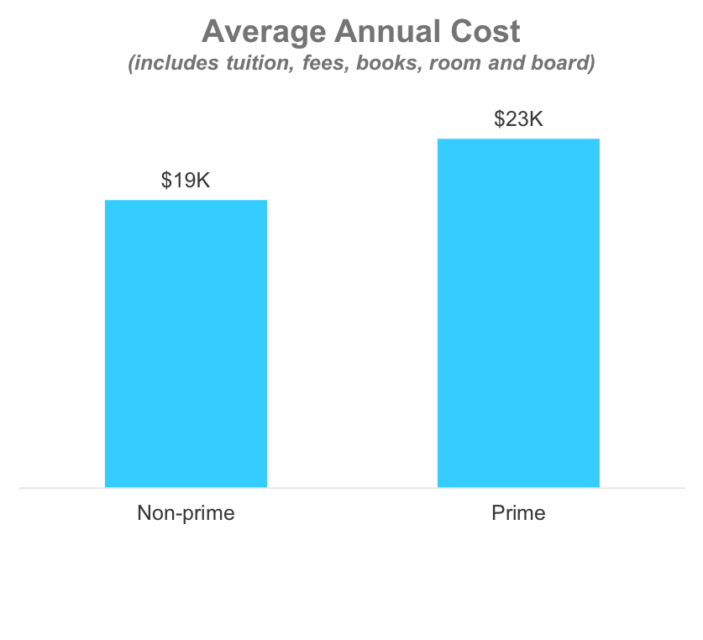
Q4. What is your best estimate of the total cost for your child or dependent to attend college for the upcoming 2018/2019 school year? Prime n=505, Non-prime n=514
Financial Assistance
Almost all non-prime students use some form of financial assistance.
While not as high as non-prime, utilization of financial aid is still quite prevalent among prime students.
Higher income doesn’t preclude use of financial aid, as 72% of prime and 85% of non-prime who come from $75K+ HH still use it (not graphed)
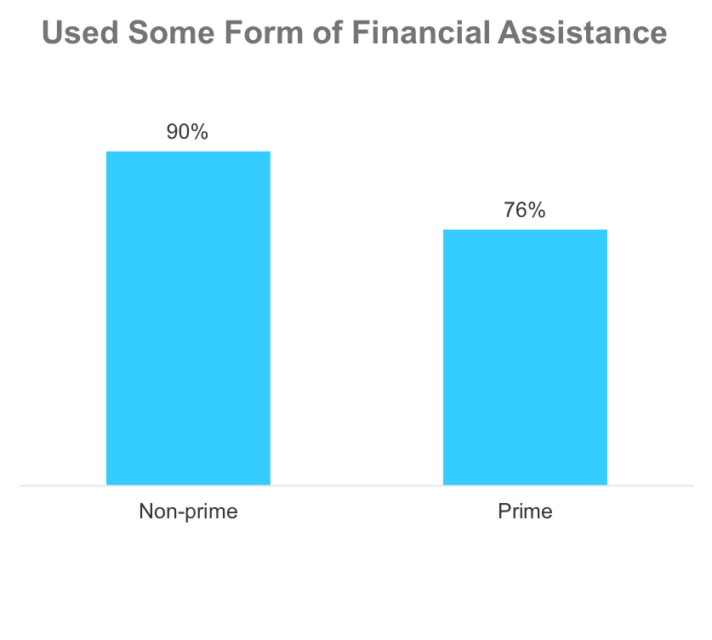
Q5. Which, if any, of the following forms of financial assistance will your child or dependent receive to help pay for the upcoming academic year? Check all that apply. Prime n=505, Non-prime n=514
Types of Financial Assistance
Students from non-prime households generally have higher utilization of financial assistance.
Almost half of college students from non-prime families use need-based grants/scholarships and/or unsubsidized student loans.
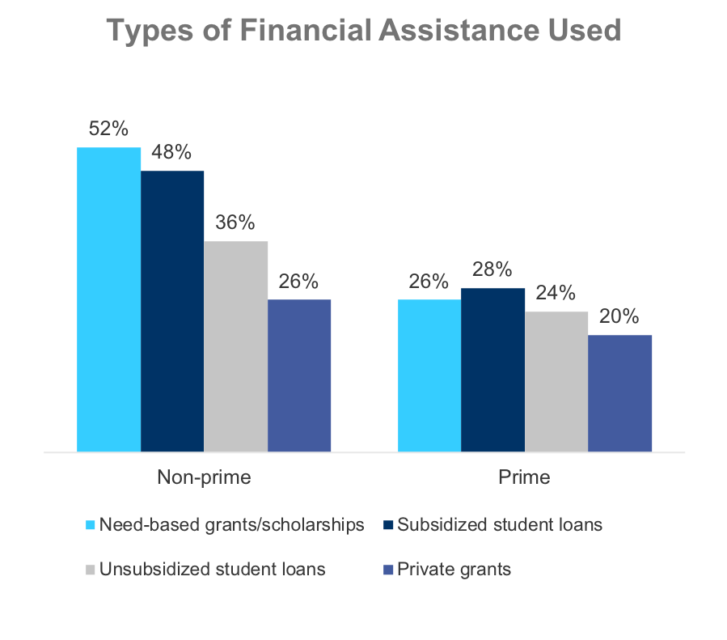
Q5. Which, if any, of the following forms of financial assistance will your child or dependent receive to help pay for the upcoming academic year? Check all that apply. Prime n=505, Non-prime n=514
Non-prime Receive Less Merit-based Aid
The credit status of a student’s parents adversely affects whether the student will receive any merit-based financial aid, suggesting that a parent’s financial chaos may affect a child’s high school performance, or that the family’s financial stresses limit the amount of time non-prime parents have to help their children find and wade through merit-based opportunities.
Q5. Which, if any, of the following forms of financial assistance will your child or dependent receive to help pay for the upcoming academic year? Check all that apply. Prime n=505, Non-prime n=514
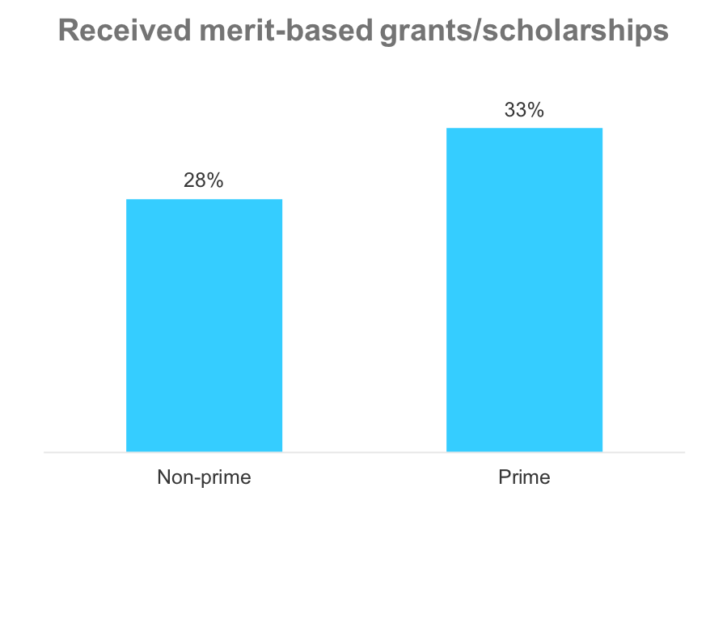
Q5. Which, if any, of the following forms of financial assistance will your child or dependent receive to help pay for the upcoming academic year? Check all that apply. Prime n=505, Non-prime n=514
Amount of Financial Assistance Expected
College students from non-prime households that do use financial assistance, expect to receive less aid by financial aid type compared to what prime students expect. What is unknown is whether this is driven by actual costs or what the student was approved for.
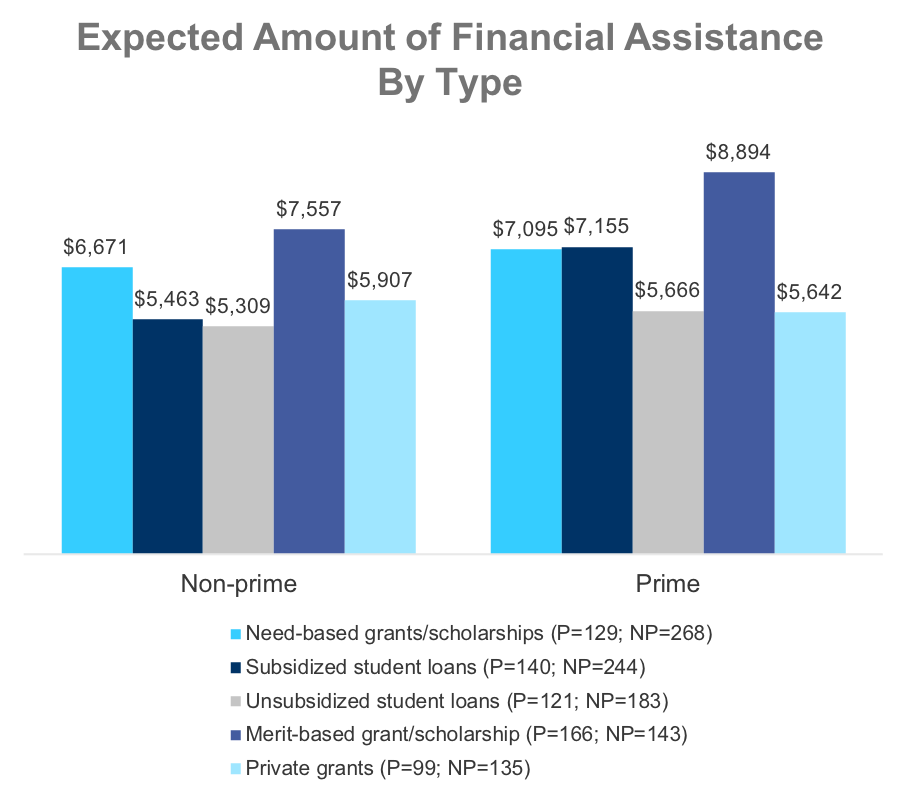
Q6. For each form of financial assistance that you checked above, please enter the amount that you or your child expects to receive to help pay for the upcoming academic year?
Contributing to Child’s Education Expenses
Across both non-prime and prime households, birth parents that do not live with students are less likely to contribute to their education, but prime parents who don’t live at home are twice as likely to contribute compared to prime parents.

Q13. If you are not living with this child’s or dependent’s other parent, does the other parent contribute to the student’s education expenses? Prime n=136, Non-prime n=296
College Tuition Impact on Family Finances
About one-third of non-prime households that contribute to their child’s college expenses experience a considerable to severe impact on their finances.
The majority of both non-prime and prime households only experience a moderate impact or none at all.
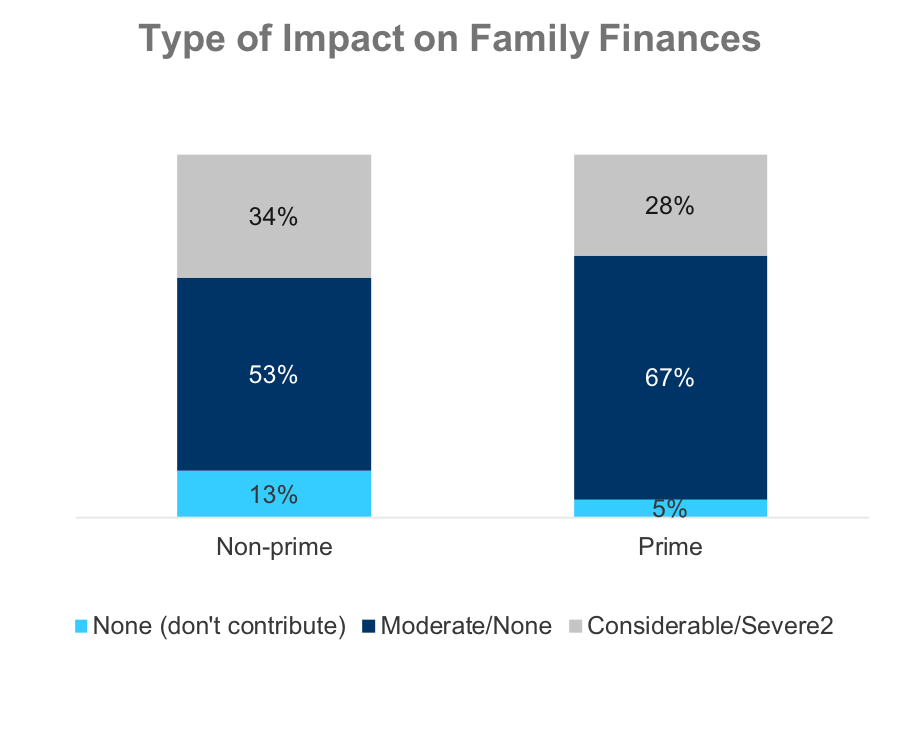
Q14. What has been the financial impact on your family of paying for your child or dependent to attend college?
Prime n=505, Non-prime n=514
Finances and Income
Overall State of Personal Finances
5x as many prime households, 41%, rate their personal finances as ‘Excellent or Very Good’ compared to non-prime households, 8%.
About a quarter, 24%, of non-prime households rate their personal finances as ‘Good’, and the remainder, 68%, rate them as ‘Fair or Poor’. (not graphed)
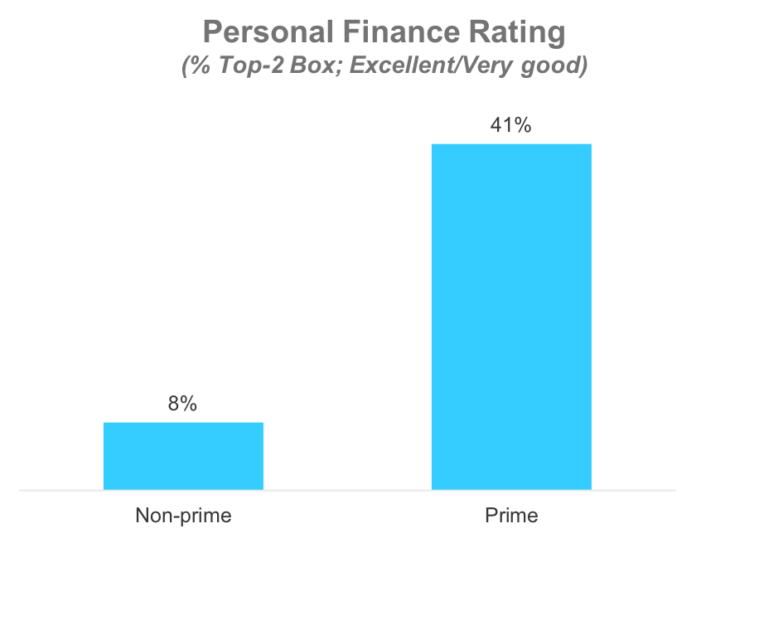
Q19. How would you rate the overall state of your personal finances today? Prime n=505, Non-prime n=514
College Parents Description of Current Debt
Almost 3 times as many non-prime families, 57%, describe their current debt load as ‘excessive’ or ‘more than they’d like’ compared to prime families, 20%.
Given that more than half of non-prime households are saddled with large amounts of debt, it’s not surprising that so many college students from these households need financial aid to attend college. (not graphed)
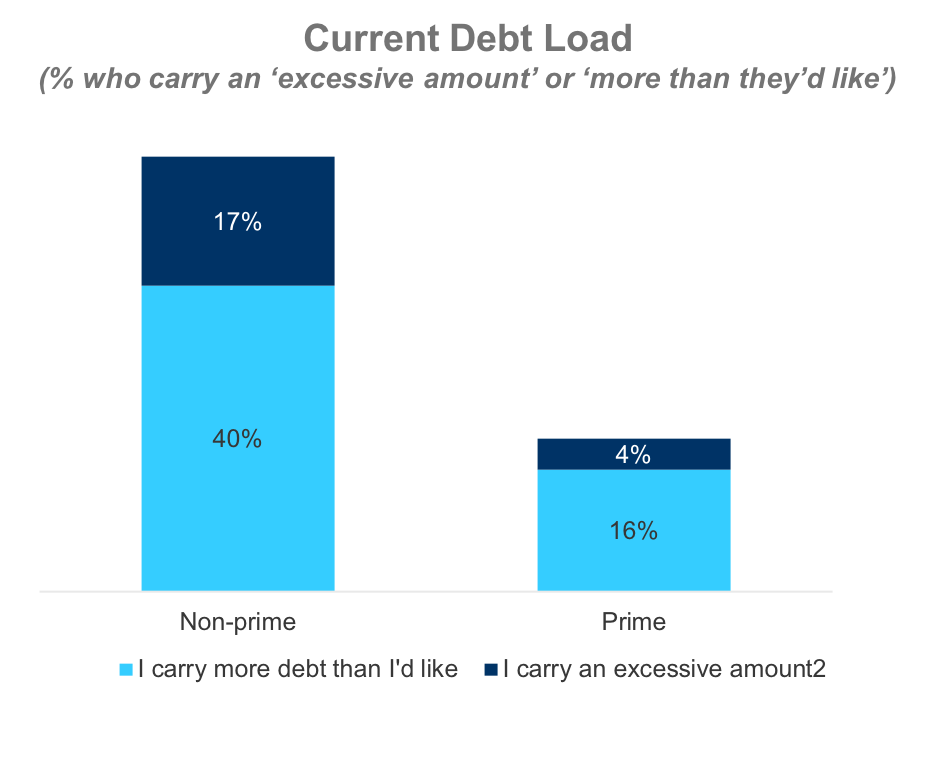
Q20. Not including any debt that you, yourself, may have borrowed for your child’s or dependent’s college education, how would you describe the total amount of debt you have right now? Prime n=505, Non-prime n=514
Number of Adults in HH Who Earn an Income
Exactly one-half of non-prime households say that only one adult earns an income.
Prime households are better positioned to cover or help with college tuition expenses given that two-thirds of them have two or more adults earning an income. (not graphed)
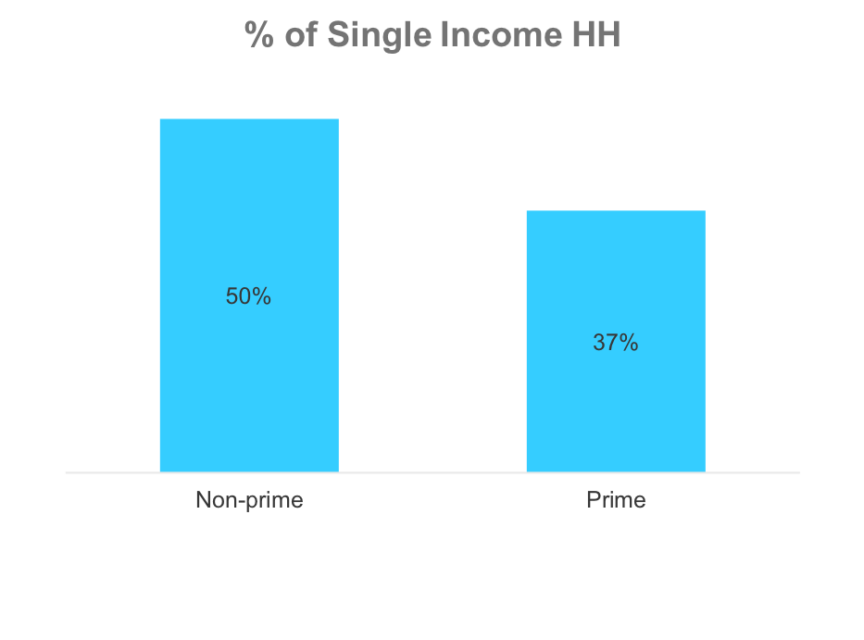
Q21. Including yourself, how many adults in your household earn an income from outside employment, a business you/they own, or retirement/investment disbursements? Prime n=505, Non-prime n=514
HH Income Among Families with a College Student
More than twice as many Prime families make $75K or more compared to Nonprime.
The mean annual income among prime HH with a college student is $106K, while it’s only $67K among non-prime HH. (not graphed)
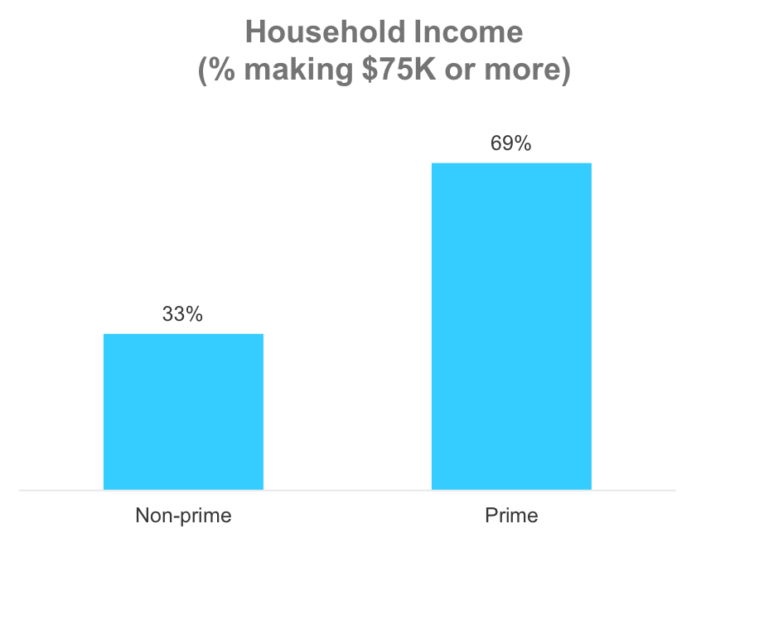
Q26. Which best describes your total annual household income? Prime n=505, Non-prime n=514
HH Income Among Families with a College Student
Compared to prime households, almost 4x as many non-prime households have monthly incomes that fluctuate so much it causes financial problems.
It’s worth noting that a plurality of non-prime households, 46%, have stable, monthly incomes, but not as many as prime households, 60%. (not graphed)
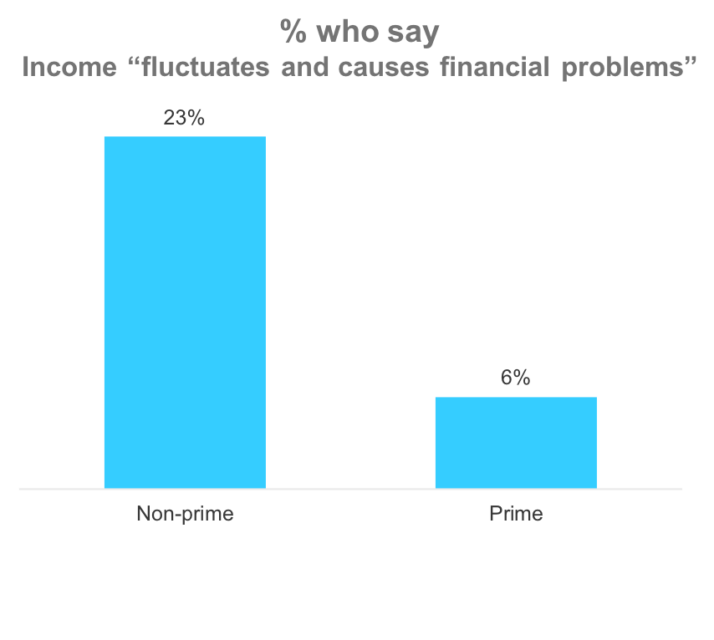
Q22. Thinking of the previous 12 months, which statement best describes your monthly household income?
Prime n=505, Non-prime n=514
HH Income Among Families with a College Student
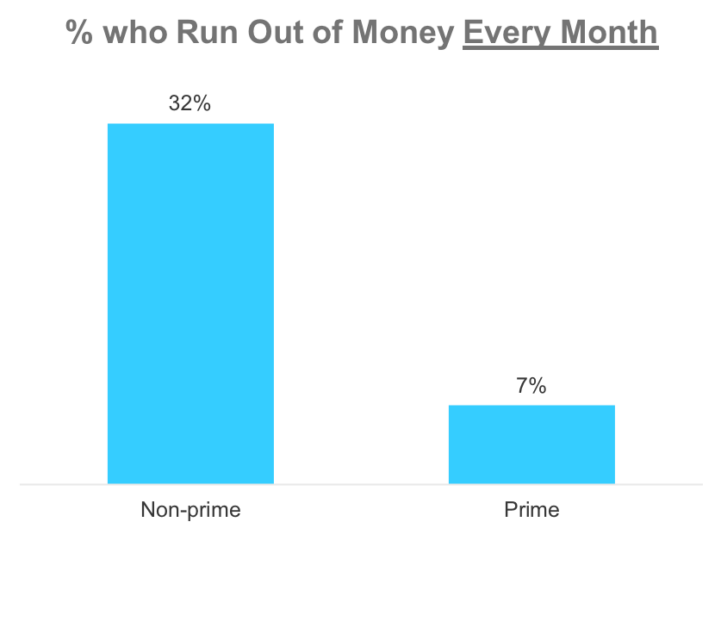
Compared to prime households, 4x as many non-prime households with a college student run out of money every month, which severely limits the ability of these families to help with college expenses.
Conversely, 58% of prime households say they never run out of money compared to only 13% of non-prime HH. (not graphed)
Methodology
The primary purpose of this study was to determine how nonprime households with a child attending college were similar or different from those with prime credit when it comes to covering college related expenses.
Interview Dates: June 14-20, 2018
Sample Specs:
•Total Respondents = 1,019 (514 non-prime, 505 prime)
•Sample Source: Research Now/SSI Panel
Qualification Criteria:
•Must have a child attending college in the Fall of 2018
•At a minimum, equally shares management of household finance
•Personal income: Any
•Geography – U.S. Rep
Survey Instrument: 11-minute online survey.
About
About Elevate’s Center for the New Middle Class
Elevate’s Center for the New Middle Class conducts research, engages in dialogue, and builds cooperation to generate understanding of the behaviors, attitudes, and experiences of America’s growing “New Middle Class.”
For more information, visit: www.elevate.com/NewMiddleClass
Contact
NewMiddleClass@elevate.com
@NewMidClass
Facebook.com/NewMiddleClass


